How do I set a breakpoint in a CLR Stored Procedure already deployed and running on a live SQL Server and debug is using Visual Studio?
For information on setup and debugging a CLR stored procedure in a direct-debug scenario by “stepping-through” the code from within Visual Studio, OR by using a test TSQL script from with Visual Studio, refer to the following MSDN article:
https://msdn.microsoft.com/en-us/library/ms165051.aspx
Now, suppose you have a stored procedure already deployed to a remote SQL Server that you need to debug by setting a break-point because you don’t know what condition is leading to the code path that is taken – you don’t know what input variables to provide to “step-through” the code from within Visual Studio using a direct debug by right clicking the stored procedure and selecting “Step Into”. Or perhaps, you want to set a conditional breakpoint to halt execution under a certain situation…
NOTICE: Do not do this on a production server – you will halt execution of all managed threads on the SQL Server and can lead to a crash of the SQL Server – only perform this on a development server!!!
In the following example, we have a CLR Stored Procedure in the AdventureWorksPTO database on a remote SQL Server – SQLTEST100 (a SQL Server 2008 box running on Windows 2008 R2). The AdventureWorksPTO database is an enhanced version of the AdventureWorks database PFEs use in our SQL Server 2005/2008 Performance Tuning and Optimization workshops. The stored procedure is in the assembly named AdventureWorksPTO_CLR_Debug_Example.
So we start out opening our project that contains the code for the CLR stored procedure:

Next, set a breakpoint in the code and setup our symbols by selecting Tools –> Options

Select the Debugging section and add the path to your PDB files for the project to the “Symbol file (.pdb) locations:” box.

On the remote computer (the SQL Server), you must have the Visual Studio Remote Debugger installed and running… If you need to install it, you can find it on the Visual Studio Installation Media. Here we start the Remote Debugger (MSVSMON):

You must provide the debugger a name string to listen for connections on… I change the name to DEFAULT@SQLTEST100:

Now it is listening:

Now, back on the development box with the Visual Studio project open, go to Tools –> Attach to Process:

Now we must specify our connection string name we specified in the Remote Debugger on the SQL Server, select the SQL Server process (sqlservr.exe) and then click to attach:

Once you have entered the connection string name, picked sqlservr.exe and clicked ATTACH, you will get a warning:

Now, using ANOTHER process separate from the Visual Studio Project, we make a call to the stored procedure. This simulates our production application calling into the stored procedure. In this example, we can just call it manually using SSMS on the SQL Server itself – SQLTEST100:

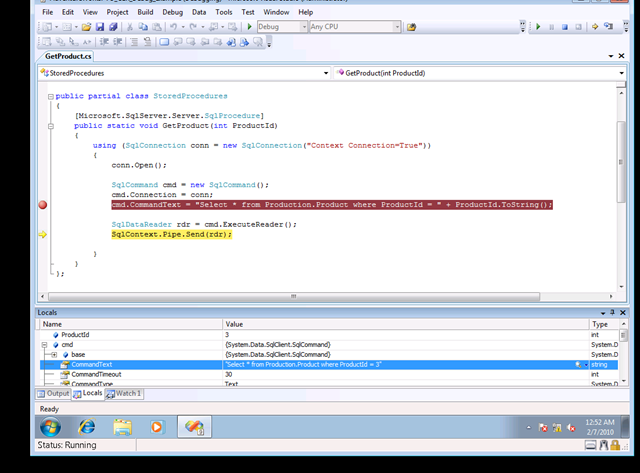
Go back to the development box into Visual Studio, and you will have hit the breakpoint you set inside the code:

From here you can do all the normal debugging you are used to with Visual Studio – set watches, change values, etc…
Here we have set a breakpoint on our stored procedure implemented using managed code (CLR code) that is already deployed to a remote SQL Server and used Visual Studio for debugging it.
- Jay