How to capture and analyze a dump file when intermittent High CPU happens on Azure Web App
When facing intermittent High CPU issue on Azure Web App, previously we have no easy method to capture dump files for further analysis because:
1. It is an intermittent issue. When you monitor the application, the high CPU may not happen at the moment or in the current process lifecycle.
2. When use Kudu site to run procdump to capture the High CPU dump, the procdump may exit before issue happens once Kudu console gets timeout/refresh, and then cause target process terminated.
Now with latest Crash Diagnoser, we can quickly configure and capture the High CPU dump. Below is the guide:
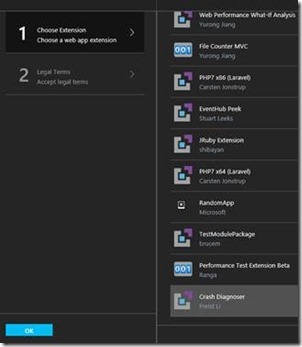
1. Open Azure Portal, navigate to App Services -> your Web App -> Tools -> Extensions.
2. Click Add, and choose Crash Diagnoser to install it.
Note: After the Site Extension was installed (take around 10 seconds), the portal will restart App by default. You may want to do this installation during non-business hours if business requires. 
3. Please make sure the web app configuration is “AlwaysOn” because the Crash Diagnoser runs as a Continuous web job. Refer to: https://blog.amitapple.com/post/73574681678/git-deploy-console-app/#.VpcHaPl96Ul
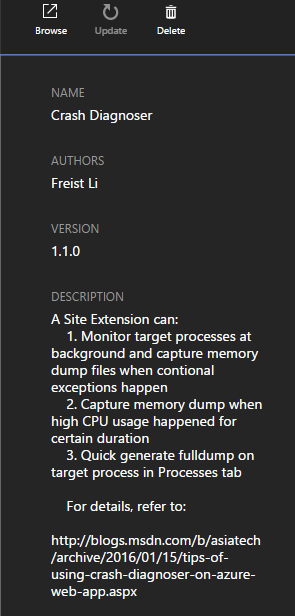
4. After installation, select it from the Installed Web App Extension blade, click Browse: 
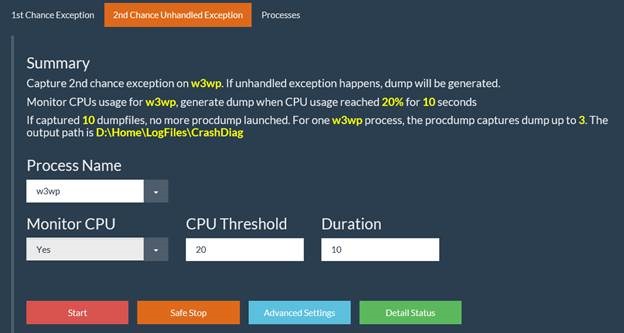
5. Click the 2nd Chance Unhandled Exception tab, choose your target process name. The default options include w3wp, node, php-cgi.
If you want to monitor other process, such as mywebjob.exe, just type the process name mywebjob manually in the field.
6. Select the Monitor CPU field as “Yes”. Set the CPU Threshold (the CPUs usage percentage to trigger dump action, the percentage is for all cores), and Duration (the CPU usage needs to be equal or above the threshold for the specific seconds). The summary info explained details. 
If you want to set other parameters, click the Advanced Settings
7. Click the Start button. Will see the title status changes: 
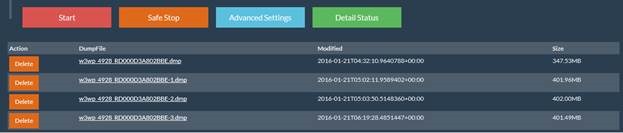
8. That’s All. If the target process meets the high CPU pattern, or crashed with unhandled exception, the useful dump will be generated immediately: 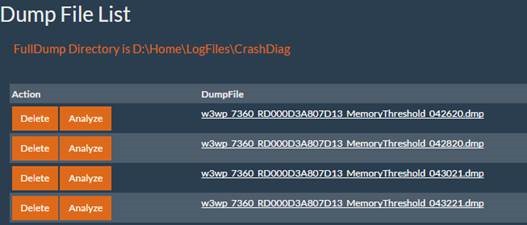
9. Click the hyperlink of the files to download them, and you can also directly analyze the generated dump files now (for exception, high cpu, high memory, etc.) by click the Analyze button. Generally you don’t need manually download dump and perform offline analyze on them through Windbg/DebugDiag. The analyzed report can be downloaded and viewed in the Report File List: 
A report sample: 
More Information Regarding Crash Diagnoser
=============================== How to capture intermittent high memory issue on Azure Web APP How to capture intermittent exceptions on Azure Web APP Troubleshoot Stack Overflow on Azure Web APP Tips of Crash Diagnoser
Thanks.
Freist