Debug Diagnostic 2.0 – Creating a Memory Leak rule (unmanaged code)
For Debug Diagnostic 1.2, please refer to
This article will detail the action plan you can implement to create a rule in Debug Diagnostic 2.0 to automate a dump when you are facing a huge memory consumption generated by some unmanaged code inside a process owned by IIS (in example a "W3WP.exe" process).
Action Plan
!!! Warning !!! A dump in "Memory Leak" mode implies the load of a DLL named "Leaktrack.dll" in the "W3WP.exe" process. This DLL will save every memory allocation/liberation and can impact application performance and in the same way impact server performance.
!!! Warning 2 !!! This rule will be valid for a unique instance of a process. This means if the process is restarted (thus his Process ID has changed), the rule will not be active anymore.
- Debug Diagnostic 2.0 can be download at the following URL:
https://www.microsoft.com/en-us/download/details.aspx?id=40336
If the operating system is 32-bit, install the 32 bit DebugDiagx86.msi. For 64 bit operating system choose the DebugDiagx64.msi.
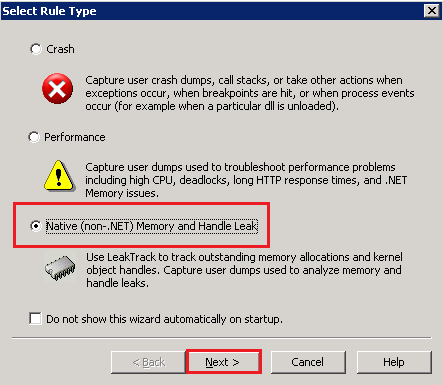
- Execute DebugDiag 2.0 Collection on the IIS server, the wizard "Select Rule Type" loads
- Choose "Native (non-.NET) Memory and Handle Leak", and then click on "Next >"

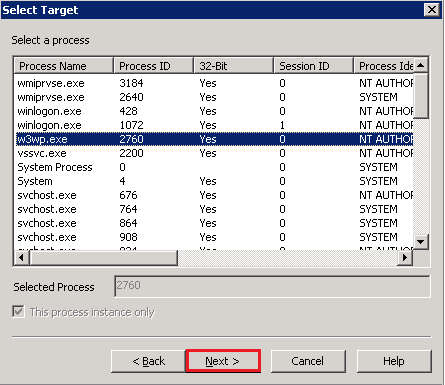
- Select the "W3WP.exe" process facing the memory consumption issue, then click on "Next >"

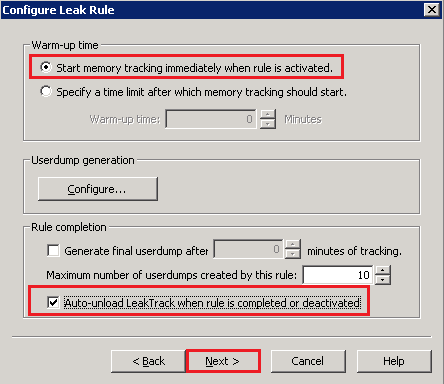
- Configure the "Configure Leak Rule" as followed:

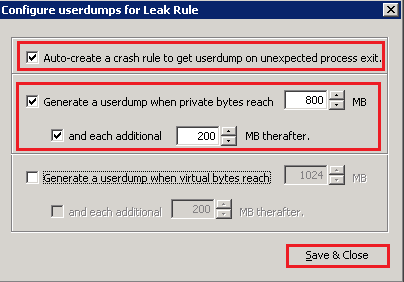
- If you are facing a private bytes memory consumption issue:
- Click on "Configure…" and set "Configure userdumps for Leak Rule" parameters as followed:

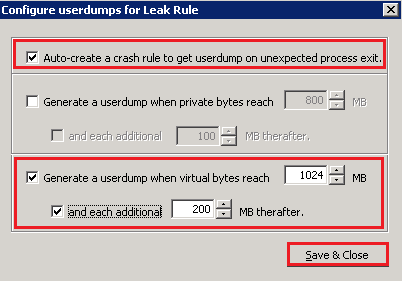
- If you are facing a virtual memory consumption issue:
- Click on "Configure…" and set "Configure userdumps for Leak Rule" parameters as followed:

- Click on "Save & Close", then click on "Next >"
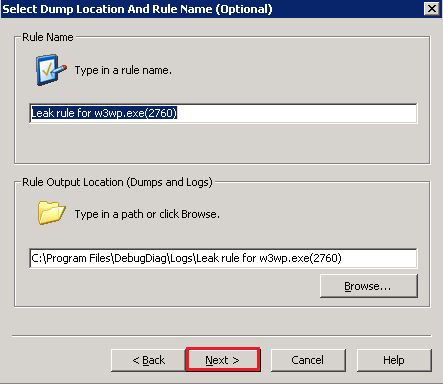
- Choose a name and a location for dumps file, then click on "Next >"
- Setting those dumps on another disk than C:\ is possible
- Please check you have enough available space disk as the dump size will be equal to the memory consumed by the process you are monitoring

- In the window "Rule Completed", select "Activate the rule now", and then click on "Finish"
- The rule is now configured and ready to generate dumps

- Check the status is "Tracking"
- If it's not, The "DbgSvc" service is surely not started
- You can go in "Administrative Tools > Services" and start it
- When a dump will be generated, you'll see the column "UserDump Count" being incremented
The dumps are located by default in "C:\Program Files\DebugDiag\Logs\Rule_Name".
Regards,
XinJin from GBSD DSI Team