


Ask Learn
Preview
Please sign in to use this experience.
Sign inThis browser is no longer supported.
Upgrade to Microsoft Edge to take advantage of the latest features, security updates, and technical support.
Note
Access to this page requires authorization. You can try signing in or changing directories.
Access to this page requires authorization. You can try changing directories.
For Debug Diagnostic 1.2, please refer to
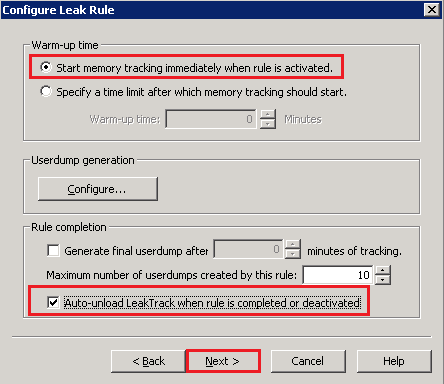
This article will detail the action plan you can implement to create a rule in Debug Diagnostic 2.0 to automate a dump when you are facing a huge memory consumption generated by some unmanaged code inside a process owned by IIS (in example a "W3WP.exe" process).
Action Plan
!!! Warning !!! A dump in "Memory Leak" mode implies the load of a DLL named "Leaktrack.dll" in the "W3WP.exe" process. This DLL will save every memory allocation/liberation and can impact application performance and in the same way impact server performance.
!!! Warning 2 !!! This rule will be valid for a unique instance of a process. This means if the process is restarted (thus his Process ID has changed), the rule will not be active anymore.
https://www.microsoft.com/en-us/download/details.aspx?id=40336
If the operating system is 32-bit, install the 32 bit DebugDiagx86.msi. For 64 bit operating system choose the DebugDiagx64.msi.
The dumps are located by default in "C:\Program Files\DebugDiag\Logs\Rule_Name".
Regards,
XinJin from GBSD DSI Team
Please sign in to use this experience.
Sign in