Azure Websites: Find PHP Performance bottleneck
Request help on troubleshooting PHP performance issues are very common requests we received from our customers. This article talks about couple of ways to identify the PHP web site performance bottleneck running on Windows Azure Websites.
Using echo function
echo function can prints helpful information on the page. Using echo function, we can print the time enter and leaving a function call. So, we can identify which function is slow.
Here is an example.
// current time
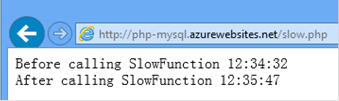
echo "Before calling SlowFunction ";
echo date('h:i:s') . "<br/>";
// sleep for a while
SlowFunction(10);
// wake up !
echo "After calling SlowFunction ";
echo date('h:i:s') . "<br/>";
Here is the output on the IE.
Using error_log function
For a production site, echo function is not acceptable as it sends the debug information to the browser, so end user can see it.
In case of this, error_log is a better option. It writes the log to the PHP error log. Here is an example code.
// current time
error_log ( "Before calling SlowFunction " . date('h:i:s') );
// sleep for a while
SlowFunction(10);
// wake up !
error_log ( "After calling SlowFunction " . date('h:i:s') );
The error log information can be found in the PHP error log. You can download the file using FTP.
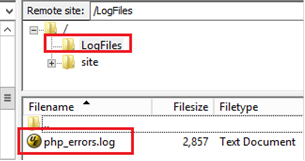
Here is a sample debug error log in the php_errors.log.
[15-Nov-2013 00:42:05 America/Los_Angeles] Before calling SlowFunction 12:42:05
[15-Nov-2013 00:43:16 America/Los_Angeles] After calling SlowFunction 12:43:16
Using XDEBUG Extension
For a production site, sometimes, you are not even allowed to modify the code to add any tracing information. In this scenario, you can consider XDEBUG extension. XDEBUG extension is a debugger and profiler for PHP. It is a very powerful tool to find out PHP web site performance bottleneck.
Configure XDEBUG Extension
1. Downlaod XDEBUG extension
The extension can be download from https://xdebug.org/download.php. Please select the right version. Azure Websites supports PHP 5.3, 5.4, 5.5 at this moment.
NOTE: |
VC11 runtime may not available on Azure Websites Please don't use the TS version (thread safe). |
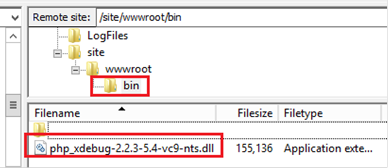
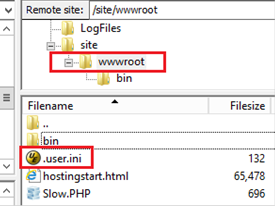
2. Upload the binary to the bin folder of your web site’s wwwroot.
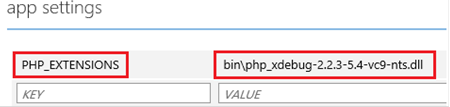
3. Configure and enable the extension for your site on the Azure portal.
4. Enable the XDEBUG profiler feature
Create a file named .user.ini with follow content and upload to your site wwwroot.
zend_extension = ".\bin\php_xdebug-2.2.3-5.4-vc9-nts.dll"
xdebug.profiler_enable=1
xdebug.profiler_output_dir="D:\home\LogFiles"
5. Restart the site.
Analyze the Profiler Data
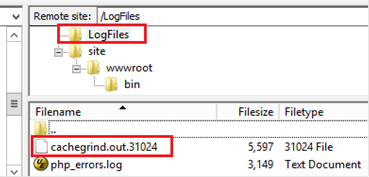
1. After enabled the XDEBUG profiler feature, you should see cachegrind.* file under LogFiles.
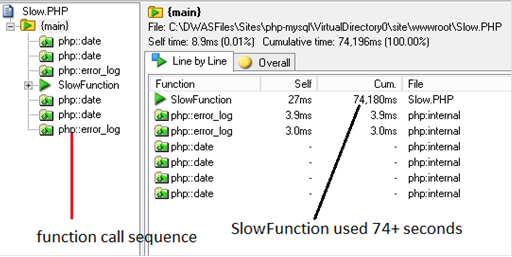
2. Download this to your local, then open using WinCacheGrind
3. Now, it is easy to see SlowFunction used 74+ seconds
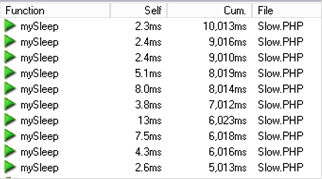
4. Expand SlowFunction for more details. We can know it calls mySleep 10 times and each call used 5~10 seconds.
See you next time,
Wei