How to troubleshoot HttpException Request timed out (ASP.NET 2.0 32-bit)
NOTE: The following steps apply to ASP.NET 2.0 (32 bit). They have not been tested in other versions of ASP.NET. For ASP.NET 4.0 64bit, please refer to:
Symptoms
========
The following warning may occur in application event logs:
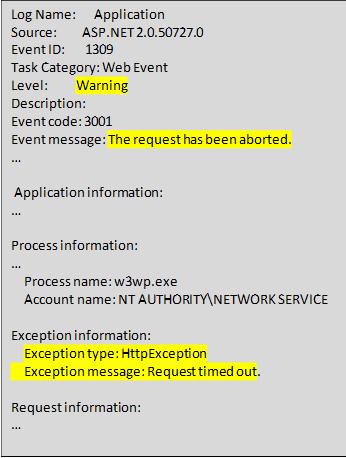
This kind of issue is typically occurs when the ASP.NET request executes for a period of time longer than the maximum timeout period allowed for server-side code execution.
This maximum timeout period can be set by executionTimeout attribute of httpRuntime element in config file. (The default value is 110 seconds in .Net 2.0)
How to reproduce
===============
Create an ASPX page named as sleep.aspx. It will sleep for 20 seconds:
<%@ Page Language="C#" %> <%@ import Namespace="System.Diagnostics" %> <script runat="server"> protected void Page_Load(object sender, EventArgs e) { DateTime time = DateTime.Now; Response.Write(String.Format("Time: {0}:{1}:{2}", time.Hour, time.Minute, time.Second) + "\tCurrent process: " + Process.GetCurrentProcess().Id.ToString()); Response.Write("<BR>"); Response.Write(String.Format("This application is running in {0}", System.Environment.Version.ToString())); System.Threading.Thread.Sleep(20000); } </script> <html> <head> <title>ASP.NET Simple Page</title> </head> <body bgcolor="#FFFFFF"> <p><asp:label id="Message" runat="server" /></p> </body> </html> |
Create a web.config and put it in the same folder as sleep.aspx. It sets the maximum timeout period to 5 seconds.
<?xml version="1.0" encoding="UTF-8"?> <configuration> <system.web> <httpRuntime executionTimeout="5"/> </system.web> </configuration> |
Use your browser to access sleep.aspx and you will receive “[HttpException (0x80004005): Request timed out.]” error message after a while. The corresponded warning will also appear in application event log.
NOTE:
You may notice that this “[HttpException (0x80004005): Request timed out.]” error message may not immediately appear in 5 seconds. Internally ASP.NET uses a Timer (an instance of System.Threading.Timer) to invoke the request cancelation process. This timer is fired once every 15 seconds. Therefore in reality the request can timeout at any time between 5 seconds and 20 seconds.
Please refer to https://blogs.msdn.com/b/pedram/archive/2007/10/02/how-the-execution-timeout-is-managed-in-asp-net.aspx
How to capture dump files for “[HttpException (0x80004005): Request timed out.]”
===============================================================
The typical *mistake* people may make is to configure a debugger to monitor HttpException and generate dump files while HttpException occurs.
In fact ASP.NET will throw ThreadAbortException when the request times out although it shows HttpException to the users.
It is not practicable to generate dump files for all ThreadAbortException. To troubleshoot this issue we have to set a breakpoint before the ThreadAbortException is thrown.
I used the following steps to capture dump files for this “[HttpException (0x80004005): Request timed out.]” error message.
Save the following text as aspnet_timeout.cfg and put it under c:\.
<ADPlus Version='2'> <!-- Configuring ADPlus to log all first chance exceptions --> <!-- Will still create full dump for any type of second chance exceptions --> <KeyWords> <keyword Name="loadbysos"> .loadby sos mscorwks </keyword> <keyword Name="GetJIT"> !name2ee System.web.dll System.Web.RequestTimeoutManager.CancelTimedOutRequests </keyword> <keyword Name="JITAddress"> .foreach /pS 0n12 ( record {!name2ee System.web.dll System.Web.RequestTimeoutManager.CancelTimedOutRequests}) { r $t1= ${record}; bp $t1+0x172 ".dump /ma /u ${AdpDumpDirEsc}\\Full Request timed out ${AdpProcName}_.dmp;g"; .printf"*breakpoint list*\n"; bl} </keyword> </KeyWords>
<Settings> <Option> NoDumpOnFirst </Option> <RunMode> CRASH </RunMode> </Settings>
<PreCommands> <DebugActions> loadbysos; GetJIT; JITAddress </DebugActions> </PreCommands>
</ADPlus> |
Open a command prompt with *elevated administrator privileges* and change the current directory to the folder where Debugging Tools for Windows is installed (The default location is %programfiles%\Debugging Tools for Windows (x86)
Run the command:
%windir%\system32\inetsrv\appcmd list wp
You will get the PID of the worker process for the problematic application pool.
Then run the following command:
adplus.exe -c c:\aspnet_timeout.cfg -o <output folder> -p <pid of problematic apppool>
Where <output foder> is the existing folder where you want to save the dump files
There will be one cdb.exe window popped up. Please keep this window running because it is monitoring the problematic application pool. If “Request timed out” occurs, it will automatically generate the dump files.
How to find out which operation causes “Request timed out” from dump files
===========================================================
Use windbg to open the dump file. Then load sos
0:025> .loadby sos mscorwks |
Dump all objects in the stack of the current thread. You will find System.Threading.Thread object:
0:025> !dso OS Thread Id: 0x444 (25) ESP/REG Object Name eax 05baf5b0 System.Threading.Thread ebx 05baf5b0 System.Threading.Thread ecx 01c4f300 System.Web.RequestTimeoutManager+RequestTimeoutEntry esi 01c4f300 System.Web.RequestTimeoutManager+RequestTimeoutEntry 0f1ff03c 05b33ad4 System.Web.Util.DoubleLinkList 0f1ff040 01c4b508 System.Collections.ArrayList 0f1ff044 05b3397c System.Web.RequestTimeoutManager 0f1ff064 01c4aa94 System.Threading.ContextCallback 0f1ff068 05b3397c System.Web.RequestTimeoutManager 0f1ff088 05b33b30 System.Threading._TimerCallback 0f1ff094 01c4b4e4 System.Threading.ExecutionContext 0f1ff0a0 01c4b4e4 System.Threading.ExecutionContext 0f1ff0a4 05b33b30 System.Threading._TimerCallback 0f1ff0b0 05b33b30 System.Threading._TimerCallback 0f1ff1c0 01c4b090 System.Collections.Hashtable+HashtableEnumerator 0f1ff25c 05b33b30 System.Threading._TimerCallback 0f1ff260 05b33b30 System.Threading._TimerCallback |
Dump the information of System.Threading.Thread object and you will find the field DONT_USE_InternalThread:
0:025> !do 05baf5b0 Name: System.Threading.Thread MethodTable: 0e3c10f8 EEClass: 0e17d994 Size: 56(0x38) bytes (C:\Windows\assembly\GAC_32\mscorlib\2.0.0.0__b77a5c561934e089\mscorlib.dll) Fields: MT Field Offset Type VT Attr Value Name 0e3b1f08 400063f 4 ....Contexts.Context 0 instance 05b20528 m_Context 0e3bd818 4000640 8 ....ExecutionContext 0 instance 01c4d2c8 m_ExecutionContext 0e3c0b24 4000641 c System.String 0 instance 00000000 m_Name 0e3c0f88 4000642 10 System.Delegate 0 instance 00000000 m_Delegate 0e3ba220 4000643 14 System.Object[][] 0 instance 00000000 m_ThreadStaticsBuckets 0e3c2cc0 4000644 18 System.Int32[] 0 instance 00000000 m_ThreadStaticsBits 0e3c3720 4000645 1c ...ation.CultureInfo 0 instance 00000000 m_CurrentCulture 0e3c3720 4000646 20 ...ation.CultureInfo 0 instance 00000000 m_CurrentUICulture 0e3c0740 4000647 24 System.Object 0 instance 00000000 m_ThreadStartArg 0e3c33ec 4000648 28 System.IntPtr 1 instance 1915fa8 DONT_USE_InternalThread 0e3c2d70 4000649 2c System.Int32 1 instance 2 m_Priority 0e3c2d70 400064a 30 System.Int32 1 instance 5 m_ManagedThreadId 0e399740 400064b 16c ...LocalDataStoreMgr 0 shared static s_LocalDataStoreMgr |
Run !threads command to list all threads and you will find the corresponded thread (whose OS thread Id is dd4) which causes “Request timed out”:
0:025> !threads ThreadCount: 7 UnstartedThread: 0 BackgroundThread: 7 PendingThread: 0 DeadThread: 0 Hosted Runtime: no PreEmptive GC Alloc Lock ID OSID ThreadOBJ State GC Context Domain Count APT Exception 8 1 1400 018ad710 8220 Enabled 05baea40:05baf074 018ac928 0 Ukn 19 2 132c 018b8658 b220 Enabled 00000000:00000000 018ac928 0 MTA (Finalizer) 22 3 16ec 018d7718 80a220 Enabled 00000000:00000000 018ac928 0 MTA (Threadpool Completion Port) 23 4 830 018d7ee8 1220 Enabled 00000000:00000000 018ac928 0 Ukn 24 5 dd4 01915fa8 380b220 Enabled 01c57b44:01c58fe8 018d8590 1 MTA (Threadpool Worker) 25 6 444 01923d00 180b220 Disabled 01c4b604:01c4d008 018d8590 0 MTA (Threadpool Worker) 14 7 180 01933348 880a220 Enabled 00000000:00000000 018ac928 0 MTA (Threadpool Completion Port) |
Switch to the problematic thread and list the call stack. You will find the sleep function:
0:025> ~~[dd4]s eax=0000002d ebx=00000000 ecx=00004e20 edx=00000000 esi=0edced40 edi=00000000 eip=777f96f4 esp=0edcecfc ebp=0edced64 iopl=0 nv up ei pl nz na po nc cs=001b ss=0023 ds=0023 es=0023 fs=003b gs=0000 efl=00000202 ntdll!KiFastSystemCallRet: 777f96f4 c3 ret 0:024> !clrstack OS Thread Id: 0xdd4 (24) ESP EIP 0edcee4c 777f96f4 [HelperMethodFrame: 0edcee4c] System.Threading.Thread.SleepInternal(Int32) 0edceea0 015806e1 ASP.sleep_aspx.Page_Load(System.Object, System.EventArgs) 0edceedc 6d59a7ff System.Web.Util.CalliHelper.EventArgFunctionCaller(IntPtr, System.Object, System.Object, System.EventArgs) 0edceeec 62562544 System.Web.Util.CalliEventHandlerDelegateProxy.Callback(System.Object, System.EventArgs) 0edcef00 6255ba44 System.Web.UI.Control.OnLoad(System.EventArgs) 0edcef14 6255ba83 System.Web.UI.Control.LoadRecursive() 0edcef2c 62557b34 System.Web.UI.Page.ProcessRequestMain(Boolean, Boolean) 0edcf084 62557764 System.Web.UI.Page.ProcessRequest(Boolean, Boolean) 0edcf0bc 62557691 System.Web.UI.Page.ProcessRequest() 0edcf0f4 62557626 System.Web.UI.Page.ProcessRequestWithNoAssert(System.Web.HttpContext) 0edcf100 62557602 System.Web.UI.Page.ProcessRequest(System.Web.HttpContext) 0edcf114 01580455 ASP.sleep_aspx.ProcessRequest(System.Web.HttpContext) 0edcf118 6255dad6 System.Web.HttpApplication+CallHandlerExecutionStep.System.Web.HttpApplication.IExecutionStep.Execute() 0edcf14c 6253132c System.Web.HttpApplication.ExecuteStep(IExecutionStep, Boolean ByRef) 0edcf18c 62b2583f System.Web.HttpApplication+PipelineStepManager.ResumeSteps(System.Exception) 0edcf190 62b1b96c [InlinedCallFrame: 0edcf190] 0edcf230 62b06071 System.Web.HttpRuntime.ProcessRequestNotificationPrivate(System.Web.Hosting.IIS7WorkerRequest, System.Web.HttpContext) 0edcf2a0 62bdb5e6 System.Web.Hosting.PipelineRuntime.ProcessRequestNotificationHelper(IntPtr, IntPtr, IntPtr, Int32) 0edcf2a4 62bdb7d7 [InlinedCallFrame: 0edcf2a4] 0edcf7f8 005522b4 [NDirectMethodFrameStandalone: 0edcf7f8] System.Web.Hosting.UnsafeIISMethods.MgdIndicateCompletion(IntPtr, System.Web.RequestNotificationStatus ByRef) 0edcf808 62bdb67d System.Web.Hosting.PipelineRuntime.ProcessRequestNotificationHelper(IntPtr, IntPtr, IntPtr, Int32) 0edcf88c 62bdb7d7 System.Web.Hosting.PipelineRuntime.ProcessRequestNotification(IntPtr, IntPtr, IntPtr, Int32) 0edcf98c 005522b4 [ContextTransitionFrame: 0edcf98c] |
Xinjin from APAC DSI