How to Support Component-Level Instrumentation Using BizTalk CAT Instrumentation Framework
In one of our recent publications, we explained the key usage patterns for the ETW-based instrumentation framework which was made available to the community on the BizTalk CAT Best Practices Code Gallery. We have received a number of insightful follow-ups and interesting questions and one of them has triggered the following post.
Scenario
A BizTalk solution running in a production environment manifests a noticeable performance degradation. The operations team investigates the problem and arrives to a conclusion that it might be related to a bottleneck in a custom component used by a number of orchestrations in the BizTalk solution. The operations team would like to collect detailed diagnostic information to assert the validity of the above assumption. They want to be able to understand the component behavior as it relates to functions being invoked, measuring accurate durations of the method calls as well as tracing parameter values being used for execution.
Luckily, the BizTalk solution was fully instrumented using the ETW instrumentation framework by following the technical guidance and best practices from the BizTalk Customer Advisory Team (CAT). The operations team has full access and all the required privileges to be able to enable ETW tracing in the production environment. However, they might face with a new challenge.
Challenge
The complexity of the BizTalk solution in question has led to implementing a number of custom components spreading across the end-to-end architecture. Virtually all custom components have been enriched with relevant tracing and instrumentation events. When enabled, the ETW trace log contains thousands of events generated by these custom components. This makes it time consuming to locate the events produced by the suspected component causing a performance degradation. In addition, many events are being written by multiple components running simultaneously on separate threads and this increases the complexity in performing trace log data analysis.
The operations team would like to streamline the troubleshooting process by capturing only those events which are directly related to the component being investigated. Ideally, they want to be able to have these events written into a separate trace log so that it can also be shared with the developers to get their input. The operations staff opens a dialogue with the development team and finds that there is a solution provided by the developers and is already available in the production codebase.
Solution
When implementing core custom components for the BizTalk solution, the development team has made a decision to support the extra level of granularity and add instrumentation at the individual component level. The advantage of this approach is that trace events produced by individual .NET components can be captured in isolation from the others. This approach opens the opportunity for collecting the detailed behavioral and telemetry data related to a specific component whilst ensuring that any events produced by other custom components will not interfere with the trace log content.
The underlying implementation has rather been very straightforward.
First, the TraceManager class from the Microsoft.BizTalk.CAT.BestPractices.Framework.Instrumentation namespace was enriched with a new public static method:
 // Returns an instance of a trace provider for the specified type. This requires that the type supplies its Guid
// which will be used for registering it with the ETW infrastructure.
public static IComponentTraceProvider Create(Type componentType)
{
    GuidAttribute guidAttribute = FrameworkUtility.GetDeclarativeAttribute<GuidAttribute>(componentType);

    if (guidAttribute != default(GuidAttribute))
    {
        return new ComponentTraceProvider(componentType.FullName, new Guid(guidAttribute.Value));
    }
    else
    {
        throw new MissingMemberException(componentType.FullName, typeof(GuidAttribute).FullName);
    }
}
Secondly, every .NET component which required to be individually instrumented was decorated with a Guid attribute available in the System.Runtime.InteropServices namespace.

Next, a new protected readonly static field was added into each non-sealed instrumented .NET component. For sealed classes, the private readonly static modifier was used. This class member is statically initialized with an instance of the framework component implementing the IComponentTraceProvider interface which provides a rich set of tracing and instrumentation methods.

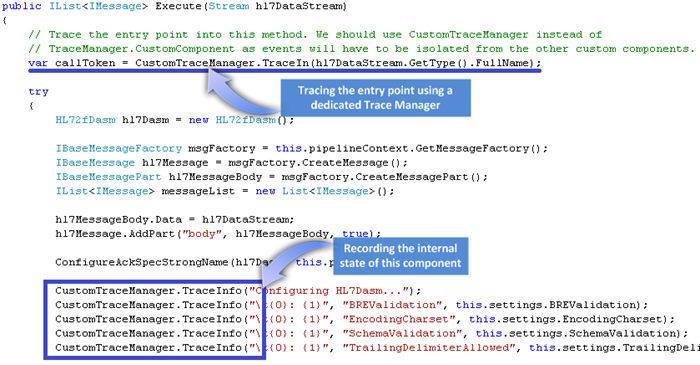
Lastly, all important aspects of the custom components’ behavior were wisely instrumented by calling the relevant tracing methods provided by the above static class member as opposed to using TraceManager.CustomComponent:

Summary
This article was intended to demonstrate the simple and very powerful approach to supporting the code instrumentation in the custom .NET components to be able to capture trace events for individual components. The benefits of this technique lies in the ability to collect only those events which are necessary to perform troubleshooting of specific components in the BizTalk solutions, eliminate “noisy events” which may come from other components, reduce the amount of events in the trace log and greatly reduce the time required to analyze the trace log data.