SSAS Profiler Issue with SSAS 2012 – Events appear as blank rows
This problem has been fixed with SSAS 2012 SP1. Similar problems have been seen with other versions.
There are two basic issues.
a) Rows are blank
When opening a previously captured trace file one may not be able to see previously captured events:
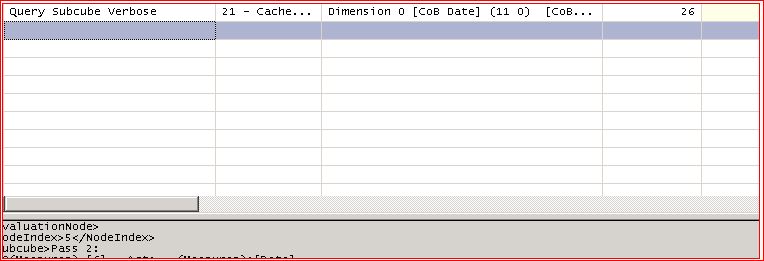
b) Events are not displayed
Sometimes when one tries to create a trace against SSAS 2012 one may note that there are events
missing from the list of full events You will only see these events:
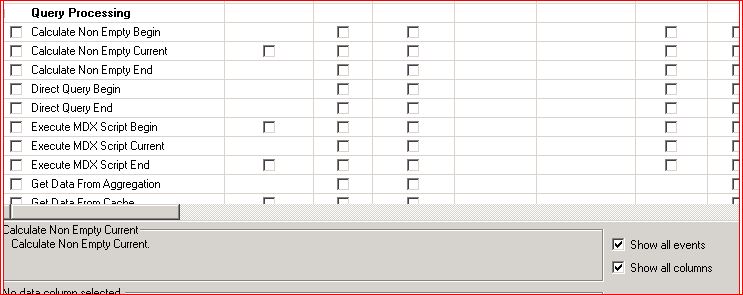
In particular these are the events that are affected:
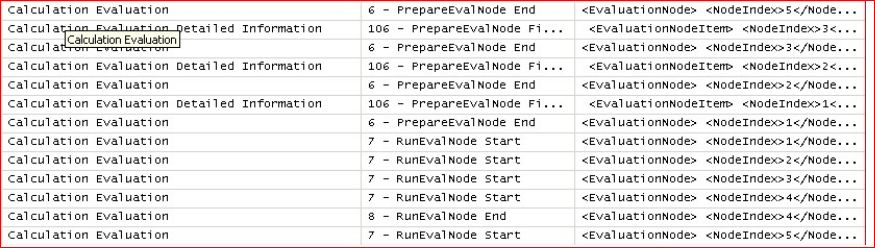
Calculation Evaluation
And
Calculation Evaluation Detailed Information
Event IDs 110 and 111.
What you should see in a trace are for example:
and in the events selection list you should see the two events that are marked:

Both issues are related to some consequence of the following.
Windows UAC is preventing the SQL Profiler application from writing to the local location
C:\Program Files (x86)\Microsoft SQL Server\110\Tools\Profiler\TraceDefinitions
And because the main version of the base TraceDefinition file that was deployed with RTM did not contain all the events that can be captured.
Temporary Workaround:
Run a SSAS trace capture by starting profiler using “run as administrator”.
Run a SSAS trace capture where UAC is off.
Permanent Workaround
Install SP1 +Cu2 to both the machine where profiler is run and the machine running SSAS. Note that the fix is in SP1 but because of other issues it is recommended to not just run SP1. The install will replace the file “Microsoft Analysis Services TraceDefinition 11.0.0.xml”
Background explanation of the observed behaviour:
When one starts a trace running and capturing a SSAS events against SQL2012 for the first time a tracedefinition file should be created in the directory :
C:\Program Files (x86)\Microsoft SQL Server\110\Tools\Profiler\TraceDefinitions
That file will contain all the events understood by that version and build of SSAS.
e.g.
Microsoft Analysis Services TraceDefinition 11.0.2100.xml
was created with build 2100.
If a trace file from a different SSAS server is opened which had a different build of SSAS say 2845.
By default the file:
Microsoft Analysis Services TraceDefinition 11.0.0.xml
Will be used to build a new tracedefinition file if the build of the other servers SSAS is not present. Thus generating a file like:
Microsoft Analysis Services TraceDefinition 11.0.2845.xml
if UAC is not on, and no file if UAC is on.
Once the 11.0.2845.xml exists it will not be re-generated. It is that file that causes the ‘blank rows’ situation still in the future.
The reason - some events were missing from the file 11.0.0.xml for builds of SSAS be SP1. So when this file is used as the base this
The SP1 version of Microsoft Analysis Services TraceDefinition 11.0.0.xml contains all the correct events.
The live missing events will occur when there was previously open by the current trace window a file that used that old 11.0.0.xml file.
There are ways to fix this but the best way is to ensure that one has SP1 +CU2 installed.
Whenever a new CU is installed against 2012 RTM you will potentially get a new file of the format 11.0.xxxx.xml. And the problems will return.
Note
you may think that you have do not this problem even before SP1 because when you start a new profiler trace and then click on show all events – it shows you them all and you can select them in to your trace and see them gathered.
If you save the trace and check the tracedefinitions directory and do not see a file of the form :
Microsoft Analysis Services TraceDefinition 11.0.xxxx.xml
Where xxxx is the build of the Analysis Server that you ran your trace against.
Then you will have this problem when you open that trace file that you just gathered and saved.