Profiling SSAS : where have my milliseconds gone ?!?
Hi Everyone,
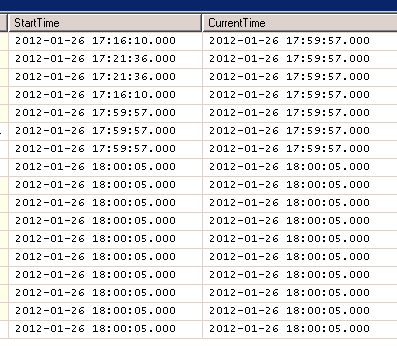
A short post to illustrate a pattern which I only recently clarified. Ever wondered why your "time" columns in a SSAS profiler trace had all .000 values for milliseconds (therefore giving you only a precision level of a second) ?
Well this seems to happen when it is the Profiler tool that collects the trace, as opposed as when the SSAS service process does it (hmm do we need another post to clarify those flows ? let me know :) )
Namely :
- you will get millisecond correctly populated when
- running a trace without the SQL Profiler GUI (= by executing the XMLA commands directly against the server)
- running a profiler trace from Profiler but using Save to Disk and Server Processes Trace Data.
- warning in that case only the trace saved to disk has the millisecond info, the GUI will only display .000. Close the trace and reopen from disk. Tadaa milliseconds party !
- you will not get millisecond data (only .000) when
- looking at an interactive trace in Profiler GUI
- and consequently if you generate your trace file by using "Save As ... trace file" in Profiler GUI after the trace is finished.
- running a profiler trace from profiler and asking that the trace is saved to disk without Server Processes Trace Data.
- in that case both the interactive and the disk version of the trace won't have milliseconds populated.
This comes from testing, I didn't fully investigate the reasons why, maybe later..
Note that this is completely separate from the microsecond precision feature of profiler for SQL Server Core DBMS engine.
Hope that helps :)
Guillaume Fourrat
