StreamInsight: Where did that query result come from (using the Event Flow Debugger in LINQPad)?
Occasionally, when working with StreamInsight queries an unusual result will crop up, leading to asking the rather blunt question “where did that come from?”. Luckily the StreamInsight Event Flow Debugger has a great feature (Root Cause Analysis) that will let us examine how certain results were generated.
If you’ve never used the Event Flow Debugger, or are having trouble working with it, please have a look through StreamInsight: Getting started with using the (Event Flow) debugger, viewing diagnostics, and exposing the management service.
We’ll start by creating a system that produces “questionable” results, then examining it with the Event Flow Debugger. This system will:
- Pull in a stream of events from the Northwind OData feed
- Look for a specific condition occuring in the Orders table (thanks to Allan Mitchell for the query idea
 ), using LINQPad and the StreamInsight driver to execute the query
If you haven’t installed LINQPad with the StreamInsight driver, the step-by-step instructions may be found at StreamInsight LINQPad Driver on the StreamInsight team blog. This tool combination makes ad-hoc querying drastically simpler, and I highly recommend dropping down the $30 for autocompletion. Well worth it!
With the system up and running, we’ll use the offline trace file capabilities of StreamInsight to capture events flowing through the system, then analyze the results to see if it “makes sense”. The details of using LINQPad to pull an OData stream from the internet and query it with StreamInsight are covered StreamInsight: Reading from other data contexts into StreamInsight with LINQPad. The trace file that I use in this blog post was generated by running the LINQ statement from that blog post.
Capturing a trace
We’ll use the offline trace capability of StreamInsight to figure out some root cause analysis of output events. From the previous post, let’s track down what went into producing this output event:
7/12/1996 7:00:00 AM +00:00
7/15/1996 7:00:00 AM +00:00
null
4
- Open up a command prompt, and navigate to the C:\Program Files\Microsoft StreamInsight 1.1\Tools directory.
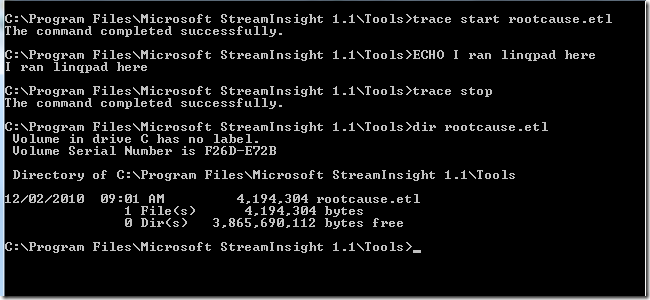
- From this directory, use trace.cmd to start capturing tracing information via trace start rootcause.etl.
- From LINQPad, execute the query again.
- From the command prompt stop tracing by executing the command trace stop.
- If you observe the contents of the C:\Program Files\Microsoft StreamInsight 1.1\Tools directory the rootcause.etl file should be visible with a non-zero length. We’ll now use the Event Flow Debugger to perform a root cause analysis.
Using the Event Flow Debugger against a Trace file
- Start the Event Flow Debugger (Start –> Microsoft StreamInsight 1.1 x64 (en) –> Event Flow Debugger).
- Click on File, then on Open.
- Browse to the C:\Program Files\Microsoft StreamInsight 1.1\Tools directory. Select the rootcause.etl file and click Open.
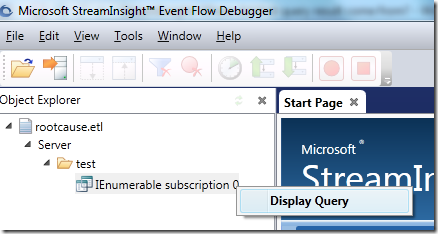
- From the Object Explorer, expand the rootcause.etl node, then the Server node, then the test application node.
- Right-click on the IEnumerable subscription 0 query, and click Display Query.
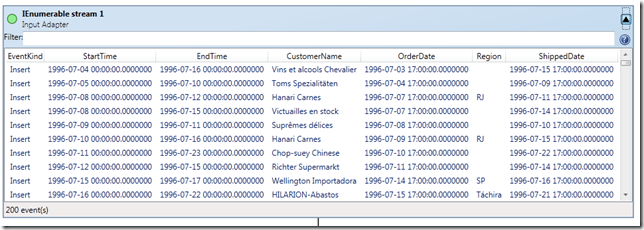
- If we expand the IEnumerable stream 1 input adapter, we’ll see all of the events that flowed into this query. We’ll come back to this in a bit, but we’re more interested right now in looking at the output and determining root cause.
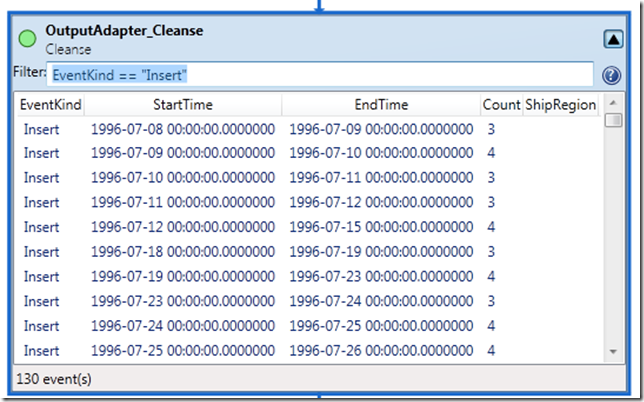
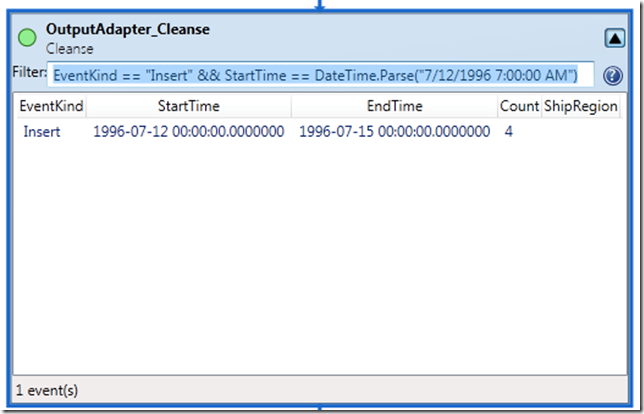
- Scroll down to the OutputAdapter_Cleanse box, and expand it. Since we’re (for this exploration) only interested in the actual output events (rather than the liveliness of the query by examining CTI’s), let’s go ahead and filter for INSERT events by adding a filter to the operator view. This filter will be EventKind == “Insert” .
- We’re trying to track down what went into producing a specific event, so let’s add a more detailed filter to the cleanse box. In this case we added “&& StartTime == DateTime.Parse(“7/12/1996 7:00:00 AM”) ”
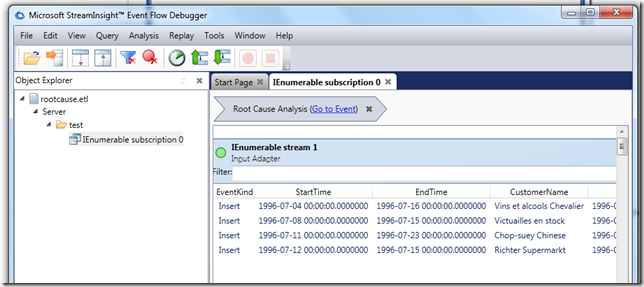
- Now that we’ve tracked down the specific event we’re interested in, let’s go ahead and see what went into producing it. Click on the event to select it, then click Analysis in the menu, and finally click Root Cause Analysis.
- Scroll back up to the input adapter, and we can now observe the four events that went into generated our output event!
Takeaways
- LINQPad, together with the StreamInsight LINQpad driver makes a great ad-hoc query and exploratory interface.
- Use the offline trace viewing capability of the Event Flow Debugger to capture query activity and investigate how your output events came to be.
