Getting the most out of user events and Windows Server AppFabric Monitoring
"Yet another post on AppFabric Monitoring" I hear you saying. Indeed, and one that you may want to read, especially if you're using AppFabric mostly for management and monitoring of code-based WCF services. If you had already looked at, or even better – used the monitoring features of AppFabric you would know that WF-based services are pretty well covered. With different monitoring levels, associated default tracking profiles, ability to assign a custom tracking profile, and more, AppFabric can easily be configured to provide comprehensive and insightful information about what's happening inside your WF services. For pure WCF services however, the story is slightly different – at the Health Monitoring level, you get a single tracking record for each WCF service call (for a successful call, it would be the OperationCompleted record). This is all good as we do get data about the number of WCF calls and whether they completed successfully or resulted in an error. But what if we need more, what if we want to understand what the business meaning of each call was - for example, how many and which ones of the PurchaseOrder transactions have been approved, or rejected by the ApprovePO() service operation. This is where AppFabric lacks of functionality, and this is what we are going to address in this post with the help of user-defined events.
User-Defined Events
So, the first thing we need to look at is the flow of tracking data through the AppFabric Monitoring infrastructure. This is pretty well described in the AppFabric core docs. Here I'm borrowing the diagram from the core docs, only to highlight that in order to emit custom tracking records for WCF services we will need to plug into the WCF Analytic Tracing infrastructure marked as (1) below:
The idea is simple - from within our service implementation we will be emitting our own analytic tracing events containing the business data that we are interested to capture and report on. Once our custom events are placed on the ETW session used by AppFabric monitoring, they will find their way, via the AppFabric Event Collector service, through to the AppFabric Monitoring database. To achieve this we will use the EventProvider class defined in the System.Diagnostics.Eventing namespace. Luckily for us, the WCF team has a sample of using the EventProvider, whereby they encapsulate the mechanics of interacting with this API into a custom class called WCFUserEventProvider. Here is the code for this class:
public class WCFUserEventProvider
{
const string DiagnosticsConfigSectionName = "system.serviceModel/diagnostics";
const int ErrorEventId = 301;
const int WarningEventId = 302;
const int InfoEventId = 303;
const int Version = 0;
const int Task = 0;
const int Opcode = 0;
const long Keywords = (long)0x20000000001e0004;
const byte Channel = 0x12;
const int ErrorLevel = 0x2;
const int WarningLevel = 0x3;
const int InfoLevel = 0x4;
EventDescriptor errorDescriptor;
EventDescriptor warningDescriptor;
EventDescriptor infoDescriptor;
bool hostReferenceIsComplete;
string hostReference;
private String HostReference
{
get
{
if (hostReferenceIsComplete == false)
{
CreateHostReference();
}
return hostReference;
}
}
EventProvider innerEventProvider;
public WCFUserEventProvider()
{
Guid providerId;
if (HostingEnvironment.IsHosted)
{
DiagnosticSection config = (DiagnosticSection)WebConfigurationManager.GetSection(DiagnosticsConfigSectionName);
providerId = new Guid(config.EtwProviderId);
hostReferenceIsComplete = false;
}
else
{
DiagnosticSection config = (DiagnosticSection)ConfigurationManager.GetSection(DiagnosticsConfigSectionName);
providerId = new Guid(config.EtwProviderId);
hostReference = string.Empty;
hostReferenceIsComplete = true;
}
innerEventProvider = new EventProvider(providerId);
errorDescriptor = new EventDescriptor(ErrorEventId, Version, Channel, ErrorLevel, Opcode, Task, Keywords);
warningDescriptor = new EventDescriptor(WarningEventId, Version, Channel, WarningLevel, Opcode, Task, Keywords);
infoDescriptor = new EventDescriptor(InfoEventId, Version, Channel, InfoLevel, Opcode, Task, Keywords);
}
public bool WriteErrorEvent(string name, string payload)
{
if (!innerEventProvider.IsEnabled(errorDescriptor.Level, errorDescriptor.Keywords))
{
return true;
}
return innerEventProvider.WriteEvent(ref errorDescriptor, name, HostReference, payload);
}
public bool WriteWarningEvent(string name, string payload)
{
if (!innerEventProvider.IsEnabled(warningDescriptor.Level, warningDescriptor.Keywords))
{
return true;
}
return innerEventProvider.WriteEvent(ref warningDescriptor, name, HostReference, payload);
}
public bool WriteInformationEvent(string name, string payload)
{
if (!innerEventProvider.IsEnabled(infoDescriptor.Level, infoDescriptor.Keywords))
{
return true;
}
return innerEventProvider.WriteEvent(ref infoDescriptor, name, HostReference, payload);
}
private void CreateHostReference()
{
if (OperationContext.Current != null)
{
ServiceHostBase serviceHostBase = OperationContext.Current.Host;
VirtualPathExtension virtualPathExtension = serviceHostBase.Extensions.Find<VirtualPathExtension>();
if (virtualPathExtension != null && virtualPathExtension.VirtualPath != null)
{
// HostReference Format
// <SiteName><ApplicationVirtualPath>|<ServiceVirtualPath>|<ServiceName>
string serviceName = serviceHostBase.Description.Name;
string applicationVirtualPath = HostingEnvironment.ApplicationVirtualPath;
string serviceVirtualPath = virtualPathExtension.VirtualPath.Replace("~", string.Empty);
hostReference = string.Format("{0}{1}|{2}|{3}", HostingEnvironment.SiteName, applicationVirtualPath, serviceVirtualPath, serviceName);
hostReferenceIsComplete = true;
return;
}
}
// If the entire host reference is not available, fall back to site name and app virtual path. This will happen
// if you try to emit a trace from outside an operation (e.g. startup) before an in operation trace has been emitted.
hostReference = string.Format("{0}{1}", HostingEnvironment.SiteName, HostingEnvironment.ApplicationVirtualPath);
}
}
Simply put, you call WriteInformationEvent(), WriteWarningEvent(), or WriteErrorEvent() from WCFUserEventProvider to emit an event of information, warning, or error type respectively. Each of these methods takes a Payload parameter, which is where you put the custom data you want to be logged in the AppFabric Monitoring store. Here's a sample code snippet using the WCFUserEventProvider class within a WCF service:
Microsoft.Samples.WCFAnalyticTracingExtensibility.WCFUserEventProvider ev = new Microsoft.Samples.WCFAnalyticTracingExtensibility.WCFUserEventProvider();
ev.WriteInformationEvent("Get completed", string.Format("{0}", Trace.CorrelationManager.ActivityId));
OK, the user-defined event is in the monitoring database. Now what?
Querying User-Defined Events
AppFabric Dashboard
Well, to start with - you could use the AppFabric Dashboard to view user events. From the dashboard, click on the Tracked Events link in the Action Pane:
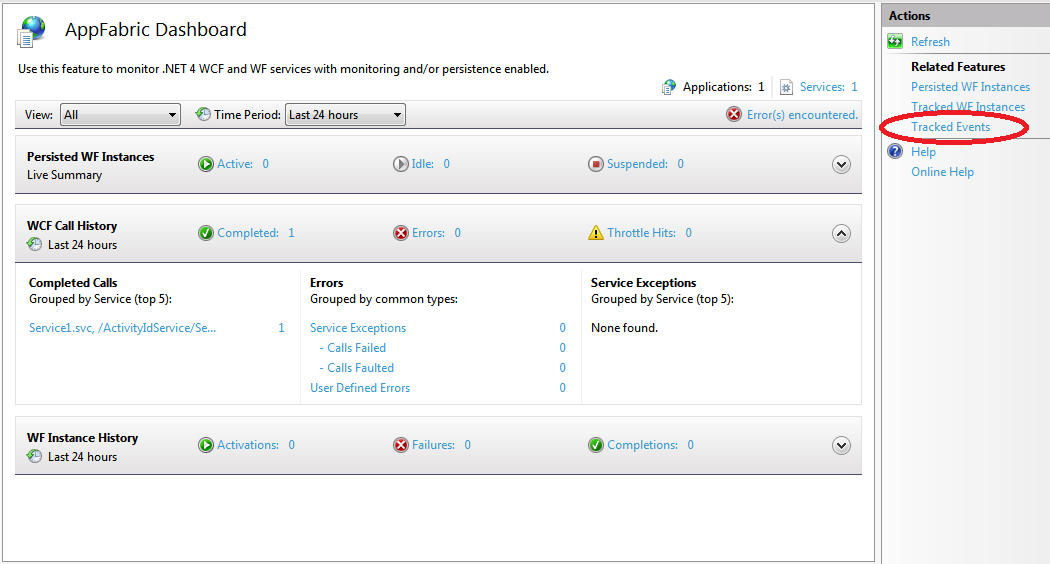
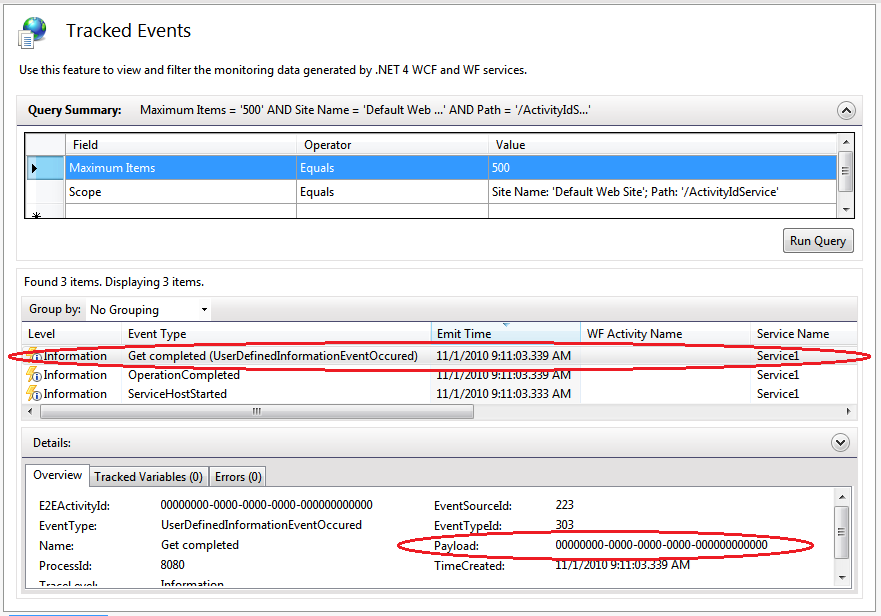
This takes us to the Query window, where we'll see all tracked WCF events, including any User-defined records with their payload:
AppFabric Dashboard limitations
With this approach however, the following limitations apply:
- If your service call emits multiple events, and you are using a Monitoring level lower than End-to-End Monitoring, there is no way to correlate these events with each other and as belonging to the same service operation call. This is due to the fact that the end-to-end activity id used for multiple events correlation is only populated for the End-to-End Monitoring level and above
- The AppFabric tooling doesn't offer functionality to query for user events using custom criteria – for example, based on the payload content
We can easily work around both limitations.
Correlation of multiple user events originating from a given service operation call
In the WCF service code, we'll ensure that we have an end-to-end activity id generated, irrelevant of the monitoring level configured for the service. An end-to-end activity id is a Guid token that, if present in the SOAP Headers of a WCF request, automatically flows through the chain of WCF service operations execution. This end-to-end activity id is recorded as part of the tracking events emitted by these operations. As mentioned previously, an end-to-end activity id is generated for the AppFabric End-to-End Monitoring and Troubleshooting levels only.
So, to ensure that an end-to-end activity id is present, we will use the following code snippet in the very beginning of the service operation implementation:
if (Trace.CorrelationManager.ActivityId == Guid.Empty)
{
Trace.CorrelationManager.ActivityId = Guid.NewGuid();
}
This code generates a new ActivityId if one is not already present.
In addition to the activity id, when generating user events we will also need to indicate which operation generated the event – this information is not part of the auto-populated properties of a user event. To get this metadata into our user events, we will construct the Name parameter of the Write<EventType>Event() methods in the following format:
<OperationName>: <Business step>
The following snippet shows how to retrieve the operation name using the OperationContext class and then log the event (note that the <Business step> is an arbitrary text indicating the logical step in the implementation):
string action = OperationContext.Current.IncomingMessageHeaders.Action;
string operationName = OperationContext.Current.EndpointDispatcher.DispatchRuntime.Operations.FirstOrDefault(o => o.Action == action).Name;
Microsoft.Samples.WCFAnalyticTracingExtensibility.WCFUserEventProvider ev = new Microsoft.Samples.WCFAnalyticTracingExtensibility.WCFUserEventProvider();
ev.WriteInformationEvent(string.Format("{0}: {1}", operationName, "Approval completed"), "APPROVED");
I'm sure by now you're tired of snippets J. So, here is the full WCF service operation implementation:
public string GetData(int value)
{
//Ensure we have an end-to-end ActivityId
if (Trace.CorrelationManager.ActivityId == Guid.Empty)
Trace.CorrelationManager.ActivityId = Guid.NewGuid();
//Get the current operation name
string action = OperationContext.Current.IncomingMessageHeaders.Action;
string operationName = OperationContext.Current.EndpointDispatcher.DispatchRuntime.Operations.FirstOrDefault(o => o.Action == action).Name;
//Implementation goes here
//Log an information event that we “approved” the transaction
Microsoft.Samples.WCFAnalyticTracingExtensibility.WCFUserEventProvider ev = new Microsoft.Samples.WCFAnalyticTracingExtensibility.WCFUserEventProvider();
ev.WriteInformationEvent(string.Format("{0}: {1}", operationName, "Approval completed"), "APPROVED");
return "Done";
}
To close on this implementation, I should also note that the ActivityId generation and the operation name retrieval can be easily rolled into the WCFUserEventProvider class implementation. This will move these repetitive and plumbing-level lines of code away from the implementation of each WCF method, leaving only the calls to the Write<EventType>Event() methods in your code.
Custom Reporting Queries
If you've read my previous article on creating custom AppFabric reports using Excel and PowerPivot, you would already know how to write T-SQL queries against the AppFabric Monitoring API (the AppFabric Monitoring public database views). The following T-SQL can be used to query for both the AppFabric out-of-the-box WCF events and our user-defined events:
SELECT
ES.Name,
CASE
WHEN E.EventTypeId IN (214, 222, 223) THEN E.OperationName
WHEN E.EventTypeId IN (301, 302, 303) THEN E.Name
END as OperationName,
CASE
WHEN E.EventTypeId = 214 THEN 'Success'
WHEN E.EventTypeId IN (222, 223) THEN 'Error'
WHEN E.EventTypeId = 301 THEN 'User Event (Exception)'
WHEN E.EventTypeId = 302 THEN 'User Event (Warning)'
WHEN E.EventTypeId = 303 THEN 'User Event (Information)'
END as EventType,
E.E2EActivityId,
E.TimeCreated,
E.Duration / 1000.0 as Duration,
E.Payload
FROM
ASWcfEvents E
JOIN ASEventSources ES ON ES.Id = E.EventSourceId
WHERE EventTypeId IN (214, 222, 223, 301, 302, 303)
ORDER BY TimeCreated DESC
This query will return the following result for a single WCF service call based on the code sample above:
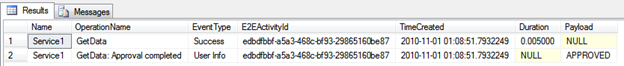
It is not hard to imagine how the second limitation can be addressed/worked around – the WHERE clause in the above query can be extended to include criteria based on the payload and looking for a specific business data or status, and then the T-SQL can be used in any database-bound reporting tool such as SQL Server Reporting Services or Microsoft Excel, with or without PowerPivot.
Conclusion
Despite some limitations in AppFabric Monitoring in regards to code-based WCF services, the technology is easily extensible with user-defined events that capture as detailed information about the services execution as necessary. Coupled with custom reports on top of the AppFabric monitoring data, user events provide the IT Pro with a comprehensive monitoring infrastructure spanning both pure WCF and WF-based services.
Thanks for reading!