Windows Server AppFabric Monitoring – Tracking Bottlenecks and Mitigation Techniques
Processing of Monitoring Data in AppFabric - Overview
Windows Server AppFabric uses a monitoring data store to capture tracking data generated by the execution of WCF and WF services. By default and out of the box, the data store implementation is a SQL Server database.
Before going further into the discussion of choosing the right deployment configuration in regards to bottlenecks mitigation, let's look at the flow of data from the Event Tracking for Windows (ETW) system used by the AppFabric runtime components, through the Event Collection service, and to the monitoring store data structures. The following diagram and steps conceptually describe the processing sequence:
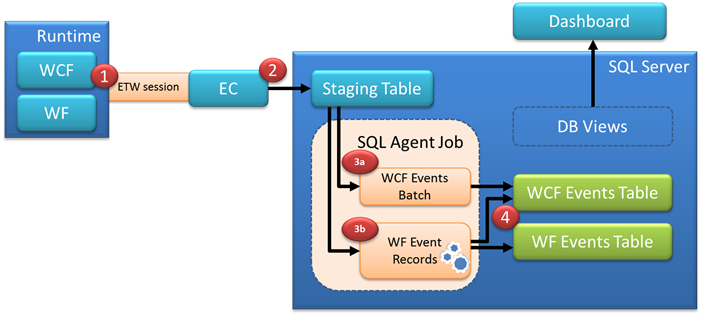
- Executing WCF and WF services emit ETW events
- The Event Collection service captures the ETW event data and writes it to a single staging table in the monitoring database
- A SQL Agent job continuously runs and checks for new event records in the staging table, parses the event data, and moves it to the long-term storage WCF and WF event tables (the data in these two tables is used by the DB views that provide information to the AppFabric Dashboard or any other custom query/reporting technologies). The staging logic for WCF and WF events is different due to the fact that WCF events are somewhat independent from each other, point-in-time events, while WF events belong to a potentially long-running entity (the workflow instance) where event correlation and temporal state and consistency are also important. With this in mind, the following processing rules apply:
- For pure WCF service events, the SQL Agent job processes staging records in bulk, from the staging table to the long-term storage WCF Events table – this is a fast batch operation in SQL, similar to executing an insert into ASWcfEventTable select top 1000 from stagingTable statement
- For WF events on the other hand, in most cases the SQL Agent job has to execute logic per staging event record before the record data can be moved to the long-term storage ASWfEventsTable. This means longer processing times, and at that point the staging job becomes a natural throttling component in the system
- The data is inserted into the WCF Events and WF Events tables.
Limitations
Performance lab tests conducted by the AppFabric CAT team show that the SQL Agent job is capable of processing between 3,500 to 4,500 staging records (events) per second on a 4 quad-core CPU BL680c server with 32GB of RAM and disk storage/file configuration aligned with common best practices for SQL deployments.
As a reference, let's look at the following simple, short-running workflow service:
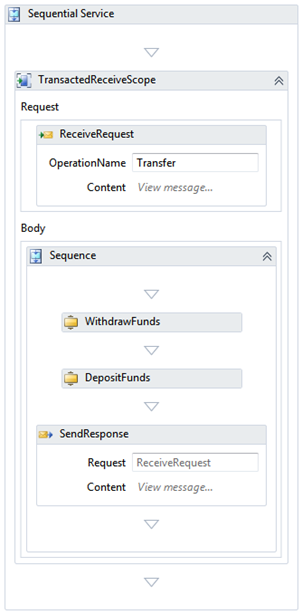
Using the "Health Monitoring" level, the end to end execution of a single workflow instance generates about 13-14 tracking events (resulting in that many staging records). This means that the incoming records rate into the staging table will break even with the SQL Agent staging job processing (drain) rate at ~285 service calls per second (4,000 records drain rate / 14 events per workflow instance = ~285 workflow instances). A higher throughput for this workflow will start building a backlog in the staging table.
Ultimately, the impact of this backlog is that the data in the "normalized" tables (and respectively the AppFabric Dashboard statistics) will be out of date, missing the information from the records that are pending processing in the staging table. Depending on the load on the system, this backlog may put the AppFabric Dashboard hours behind of what is really happening in the system.
Note: For pure code-based WCF services, AppFabric has the ability to aggregate operation call statistics prior to sending the tracked information to the monitoring store. The default sampling/aggregation interval is 5 seconds, resulting in a single event being emitted to the monitoring store for each service operation, no matter how many times it has been called within the configured sampling interval.
Mitigations
Reducing the amount of generated tracking data
If a single WF service within the environment has a constant load that generates more records than the staging job drain rate, then the mitigation options are limited to:
- Turning monitoring off for this service (either using the AppFabric management UI or the Set-ASAppMonitoring PowerShell cmdlet with the MonitoringLevel parameter set to "Off")
- Reducing the monitoring level to Errors Only (either using the AppFabric management UI or the Set-ASAppMonitoring PowerShell cmdlet with the MonitoringLevel parameter set to "ErrorsOnly"). This will only forward error-type events to the monitoring stores, thus dramatically reducing the number of records produced into the staging table
- Defining a custom tracking profile that only includes the events of interest, such as major "milestones" in the workflow, instead of capturing start/complete events from all activities in the workflow. For step-by-step instructions for creating a custom tracking profile, refer to this online tutorial.
Distributing the monitoring store infrastructure
If a number of services jointly contribute to an incoming staging records rate higher than the backlog threshold, the best option is to provision multiple monitoring stores and configure the services to capture their tracking data into different monitoring stores. Using PowerShell cmdlets, the sequence to achieve this is:
Initialize a new monitoring store using the Initialize-ASMonitoringSqlDatabase cmdlet
Add the connection string to the newly created monitoring store to the web.config file. The following command can be used for this task:
appcmd set config /clr:4 /commit:WEBROOT /section:connectionStrings /+[connectionString=' <connectionStringValue> ',name=' <ConnectionStringName> ',providerName='System.Data.SqlClient']
Note: This sample uses the SQL Server provider.
Configure your service to use the new monitoring store by using the Set-ASAppMonitoring cmdlet.
The resulting topology is depicted below, without a single SQL Agent job as a bottleneck:
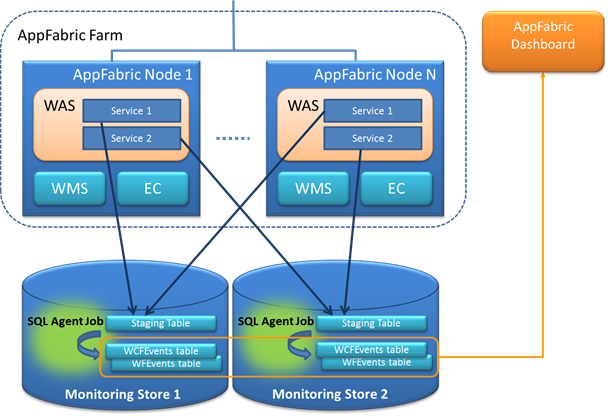
As long as the disk I/O of your storage configuration can support the load, the physical location of the monitoring data stores may vary - the same SQL Server (potentially using different disk volumes for each DB), different SQL Server instances on the same server, or completely different SQL Server installations. As each monitoring database comes with a corresponding SQL Server Agent job, the total staging throughput is increased by virtue of "partitioning" the monitoring infrastructure.
It is important to keep in mind that the AppFabric End-to-End Activity monitoring level only works for services that use the same monitoring store, which obviously does not apply when multiple stores are used.
Hybrid configuration – reducing generated tracking data and scaling out to multiple monitoring stores
The two mitigation techniques can be combined to ensure that AppFabric can support the monitoring load generated by the services deployed to the environment – with a hybrid approach, services that generate large volumes of tracked events, or as a group require end-to-end tracking, can be configured with tracking profiles that only capture key events (such as "milestone" activities), while independent services (or group of services) would forward their tracking data to a different monitoring store or stores.
Conclusion
As long as the limitations imposed by the throttled staging job are recognized during the deployment planning phase, the flexible AppFabric monitoring infrastructure can be configured to support large volumes of tracking data – 1) by carefully selecting the information to be captured and recorded, and 2) by scaling out to multiple monitoring stores.
Additional Resources and References
- Full reference of AppFabric Hosting and Management PowerShell cmdlets
- Optimizing Database Performance section from the BizTalk Server Performance Optimization Guide (guidance for pre- and post- SQL optimizations is generic and fully applies to AppFabric databases)
- Monitoring Applications section in the AppFabric documentation