Management Tasks for BizTalk CAT Instrumentation Framework - Fully Explained
The following post is intended to drill down into most common administrative tasks involved in the ETW event trace session management, specifically, as it relates to getting the true value of the BizTalk CAT Instrumentation Framework by being able to extract data out of the instrumented BizTalk application code into traditional human-readable trace log file.
Event Trace Management Application Landscape
The Event Tracing for Windows (ETW) infrastructure provides the ability to start and stop event tracing sessions, monitor their status, configure a variety of logging settings such as buffer size, flush interval, stop conditions and more. The majority of the administrative tasks are available from both the GUI and the command-line interface to suit the needs and preferences of different IT persona types.
In addition to using the Reliability and Performance Monitor, the application developers and technical teams have access to other system tools and scripts helping automate many aspects of event trace management:
- Logman creates and manages Event Trace Session and Performance logs and supports many functions of Performance Monitor from the command line.
- WEvtUtil enables to retrieve information about event logs and publishers, install and uninstall event manifests, run queries, export, archive, and clear logs.
- Tracelog starts, stops, or enables trace logging.
- Tracefmt formats and displays trace messages from an event trace log file or a real-time trace session.
The BizTalk CAT Instrumentation Framework simplifies the use of the above tools by providing 2 easy-to-use scripts with a minimum of command-line parameters. These scripts can be found in the TracingTools folder and are intended to address the following requirements:
- StartTrace.cmd provides the ability to start an ETW event trace session either for the entire instrumented BizTalk solution, its selected component types or individually instrumented classes. This script is nothing more than just a wrapper for the Tracelog tool from the Windows Resource Kit.
- StopTrace.cmd carries the responsibility for stopping the ETW event trace sessions and converting a binary trace log file into human-readable format. This script relies on Tracelog and Tracefmt tools to flush, stop and apply formatting to the trace logs.
The next section is intended to clarify how the above administrative scripts map to various management scenarios.
Event Trace Management Tasks
Once deployed and launched, a well instrumented BizTalk application will be ready to emit a number of events related to the application’s behavior, internal state, execution scope durations, runtime exceptions and everything else that the application developers decided to include into the instrumentation context. The top management tasks involved into capturing, filtering and persisting the instrumented events can be summarized as follows.
Starting Event Trace Sessions
To start an event tracing session for the entire instrumented BizTalk application, run StartTrace.cmd using one of following commands depending on the trace level required (all/high/medium/low). Note that the log file name specified after -log parameter can be any name but should not contain whitespaces.
  : All trace events (Info, Details, Warning, Error, In, Out, Start Scope, End Scope)
StartTrace -log BtsAppAllEvents -level all : Limited trace events (Info, Warning, Error)
StartTrace -log BtsAppCoreEvents -level high : Trace events indicating unexpected behavior (Warning, Error)
StartTrace -log BtsAppUnexpectedEvents -level medium : Trace events related to runtime exceptions (Error)
StartTrace -log BtsAppExceptions -level low
To start an event tracing session for a specific type of application components, run StartTrace.cmd using one of following commands depending on the component type and trace level required:
  : Start trace for all instrumented pipeline components
StartTrace -log PipelineComponentsAllEvents -level all -component Pipeline : Start trace for all instrumented orchestrations
StartTrace -log OrchestrationsAllEvents -level all -component Workflow : Start trace for all instrumented data access components
StartTrace -log DataAccessComponentsAllEvents -level all -component DataAccess : Start trace for all instrumented maps or custom transform code
StartTrace -log MapsAllEvents -level all -component Transform : Start trace for all instrumented Web/WCF services or service proxies
StartTrace -log WCFServicesAllEvents -level all -component Service : Start trace for all instrumented business rules
StartTrace -log BusinessRulesAllEvents -level all -component Rules : Start trace for all instrumented BAM activities
StartTrace -log BAMActivitiesAllEvents -level all -component Tracking : Start trace for all instrumented custom .NET components
StartTrace -log CustomComponentsAllEvents -level all -component Custom
To start an event tracing session for individually instrumented application components, the component’s Guid attribute value must be provided in the command line as per the following examples:
  : Start trace to capture all events for instrumented HL7Disassembler component
StartTrace -log HL7DasmFullTrace -level all -component Custom -guid 0EC4A54D-6B97-47C1-9118-A2BF8B4E7595 : Start trace to capture errors in instrumented HL7Disassembler component
StartTrace -log HL7DasmErrorTrace -level low -component Custom -guid 0EC4A54D-6B97-47C1-9118-A2BF8B4E7595
Monitoring Event Trace Sessions
After an event tracing session is started, it will remain running until it is manually stopped, a stop condition is encountered or host is rebooted. To query the present status of the event tracing sessions, one of the following approaches can be used.
To find out the event tracing session status from the command line, run the Logman utility using the following syntax:
  : Lists all event tracing sessions configured on the local machine
Logman query -ets : Lists all event tracing sessions with a name matching the specified pattern
Logman query -ets | find "AllEvents"
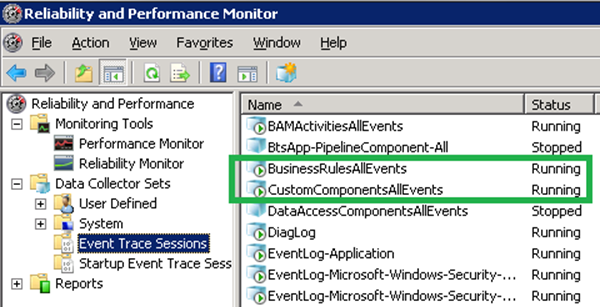
To find out the event tracing session status from the GUI, open Reliability and Performance Monitor and navigate to the Event Trace Sessions section.

Stopping Event Trace Sessions
To stop a running event trace session, the target tools differ depending on whether or not the trace session must be temporarily suspended or terminated with no intent to resume. Consequently, one of the following approaches can be used.
To stop an event tracing session from the command line, run StopTrace.cmd passing the original name of the trace log without file extension:
  : Stop trace for all instrumented pipeline components
StopTrace -log PipelineComponentsAllEvents : Stop trace for all instrumented orchestrations
StopTrace -log OrchestrationsAllEvents : Stop trace for all instrumented data access components
StopTrace -log DataAccessComponentsAllEvents : Stop trace for all instrumented maps or custom transform code
StopTrace -log MapsAllEvents : Stop trace for all instrumented Web/WCF services or service proxies
StopTrace -log WCFServicesAllEvents : Stop trace for all instrumented business rules
StopTrace -log BusinessRulesAllEvents : Stop trace for all instrumented BAM activities
StopTrace -log BAMActivitiesAllEvents : Stop trace for all instrumented custom .NET components
StopTrace -log CustomComponentsAllEvents
Note that StopTrace.cmd will also convert the binary trace log into text-based format using the Tracefmt tool. Depending on the log size and disk IO performance, this operation can take a few minutes.
To temporarily suspend an event tracing session from the command line without producing a text-based log file, run the Logman utility using the following syntax:
  : Stop event tracing sessions all instrumented pipeline components, do not convert log into text file
Logman stop PipelineComponentsAllEvents -ets
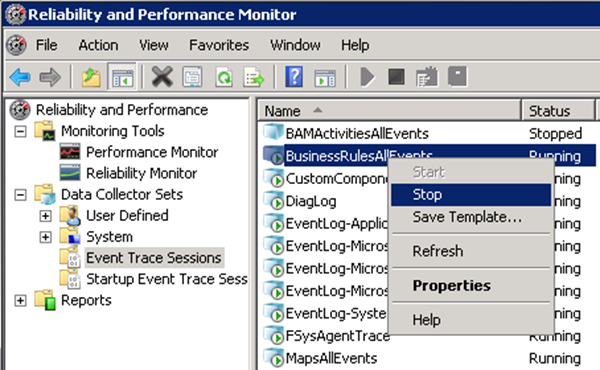
To temporarily suspend the event tracing session from the GUI, open Reliability and Performance Monitor, navigate to the Event Trace Sessions section, right-click on the target event tracing session and select Stop from the context menu:

Configuring Event Trace Sessions
The default configuration of the ETW event trace sessions created by StartTrace.cmd can be attributed as follows:
- Buffer Size: 128K
- Maximum Buffers: 100
- Log Mode: Circular
- Maximum Log Size: 1000MB
- Flush Time: Not Set
- Clock Type: Performance
- Stream Mode: File
- Pre-allocate File Space: No
Should the default configuration be found insufficient and need modifications, the script can be updated to include the desired configuration settings. The new settings must be specified in the following line in StartTrace.cmd:
"%TraceLogTool%" -cir 1000 -b 128 -max 100 -start %TraceLogName% -flags %TraceLevel% -f %TraceLogFileName% -guid #%TraceComponentGUID%
Note that all commands shown in blue will not require any modification. Below are the summary of command line parameters supported by the Tracelog tool:
Usage: tracelog [actions] [options] | [-h | -help | -?] actions:<br> -start [LoggerName] Starts up the [LoggerName] trace session<br> -stop [LoggerName] Stops the [LoggerName] trace session<br> -update [LoggerName] Updates the [LoggerName] trace session<br> -enable [LoggerName] Enables providers for the [LoggerName] session<br> -disable [LoggerName] Disables providers for the [LoggerName] session<br> -flush [LoggerName] Flushes the [LoggerName] active buffers<br> -remove GlobalLogger Removes registry keys that activate GlobalLogger<br> -enumguid Enumerate Registered Trace Guids<br> -q [LoggerName] Query status of [LoggerName] trace session<br> -l List all trace sessions<br> -x Stops all active trace sessionsoptions:<br> -b <n> Sets buffer size to <n> Kbytes<br> -min <n> Sets minimum buffers<br> -max <n> Sets maximum buffers<br> -f <name> Log to file <name><br> -append Append to file<br> -prealloc Pre-allocate<br> -seq <n> Sequential logfile of up to n Mbytes<br> -cir <n> Circular logfile of n Mbytes<br> -newfile <n> Log to a new file after every n Mbytes<br> -ft <n> Set flush timer to n seconds<br> -paged Use pageable memory for buffers<br> -noprocess Disable Process Start/End tracing<br> -nothread Disable Thread Start/End tracing<br> -nodisk Disable Disk I/O tracing<br> -nonet Disable Network TCP/IP tracing<br> -fio Enable file I/O tracing<br> -pf Enable page faults tracing<br> -hf Enable hard faults tracing<br> -img Enable image load tracing<br> -cm Enable registry calls tracing<br> -um Enable Process Private tracing<br> -guid <file> Start tracing for providers in file<br> -rt Enable tracing in real time mode<br> -kd Enable tracing in kernel debugger<br> -age <n> Modify aging decay time to n minutes<br> -level <n> Enable Level passed to the providers<br> -flag <n> Enable Flags passed to the providers<br> -eflag <n> <flag...> Enable flags (several) to providers<br> -ls Generate Local Sequence Numbers<br> -gs Generate Global Squence Numbers<br> -heap Use this for Heap Guid<br> -critsec Use this for CritSec Guid<br> -pids <n> <pid1... > Tracing for Heap and CritSec for different process
For more information on the related topic, please visit the following resources:
- “Logman Utility Command-line Reference” on TechNet
- “Tracelog Utility Command-line Reference”article in the MSDN Library
- “Controlling Event Tracing Sessions” article in the MSDN Library
- “Tools for Software Tracing“ article in the MSDN Library