Testing Client Latency to SQL Azure
[This article was contributed by the SQL Azure team.]
SQL Azure allows you to create your database in datacenters in North Central US, South Central US, North Europe, and Southeast Asia. Depending on your location and your network connectivity, you will get different network latencies between your location and each of the data centers.
Here is a quick way to test your Network latency with SQL Server Management Studio:
1) If you don’t have one already, create a SQL Azure server in one of the data centers via the SQL Azure Portal.
2) Open the firewall on that server for your IP Address.
3) Create a test database on the new server.
4) Connect to the server/database with SQL Server Management Studio 2008 R2. See our previous blog post for instructions.
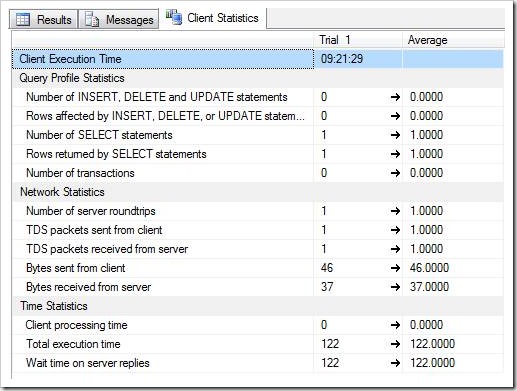
5) Using a Query Window in SQL Server Management Studio, turn on Client Statistics. You can find the option on the Menu Bar | Query | Include Client Statistics, or on the toolbar (see image below.)
6) Now execute the query:
SELECT 1
7) The query will make a round trip to the data center and fill in the client statistics.
8) Execute the same query several times to get a good average against the data center.
9) If you are just using this server for testing, drop your server, choose another data center and repeat the process with a new query window.
Reading the Results
The first two sections (Query Profile Statistics and Network Statistics) are not interesting and should be very similar to mine in the image above. The third section, Time Statistics, is what we want to study.
Client processing time: The cumulative amount of time that the client spent executing code while the query was executed. Alternatively, is the time between first response packet and last response packet.
Total execution time: The cumulative amount of time (in milliseconds) that the client spent processing while the query was executed, including the time that the client spent waiting for replies from the server as well as the time spent executing code.
Wait time on server replies: The cumulative amount of time (in milliseconds) that the client spent while it waited for the server to reply. Alternatively, the time between the last request packet left the client and the very first response packet returned from the server.
You want to find out which data center has a low average Wait time on server replies, this will be the least amount of network latency and with the best performance network for your location.
If you are reading this before June 7th 2010, you have a chance to attend Henry’s Zhang’s talk at TechEd, called: “COS13-INT: Database Performance in a Multi-tenant Environment”. This talk will cover this topic and more.
Do you have questions, concerns, comments? Post them below and we will try to address them.

