Counters, counters, counters!
Typical (painful) troubles in the troubleshooter life are memory leaks or, generally speaking, issues related to large unexpected resource consumption. Sometimes those issues happen on production environments (we all know testing should have been done before, but this kind of problems keep on occurring on production environments, who knows why ) and sometimes we’re not allowed to work on those machines in person.
Typical situation: an application dies every day at about the same time, access on the machine can’t be granted to us, an operator without any technical skills is the only person allowed to perform actions on that machine. We need to collect Performance Monitor counters and, even though we describe how to configure Perf.Mon.exe in detail, the error chances are very high.
Well, the ideal solution is LogMan.exe: it manages and schedules performance counter and event trace log collections on local and remote systems. Configuring PerfMon.exe in order to exactly retrieve the data we need to troubleshoot the issue is not always easy, besides what if you have to repeat the configuration on many servers? Through LogMan.exe you' are able to create a batch/script file to automatically configure the counters/traces you need, because LogMan.exe is a command line tool.
Let's start by opening a command window and digit:
logman create counter perf_log -c "\Processor(_Total)\% Processor Time"
Let's have a look at permon.exe now:
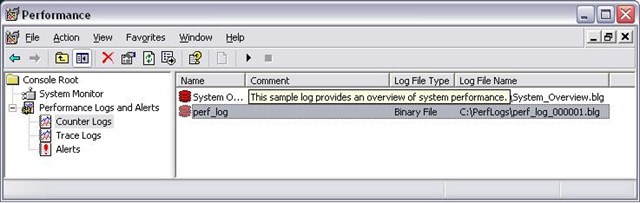
We have to start collecting processor time counter, so digit:
logman start perf_log
Now the logging activity appears started:
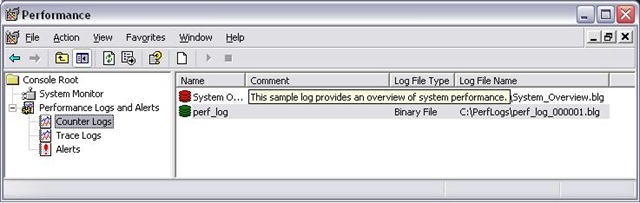
As you can easily figure out, to stop the logging:
logman stop perf_log
And now a more complex (and useful) sample: how to collect memory counters for a .NET application. Let's assume you need process memory and .NET memory counters every 15 sec, saved in a binary file, here's the batch file you could need:
 @echo off
@echo *** Creating counter ***
Logman.exe create counter Perf-Counter-Log -o "C:\PerfLogs\Perftest.blg" -f bin -v mmddhhmm -c "\.NET CLR Memory(ProcessName)\# Bytes in all Heaps" "\.NET CLR Memory(ProcessName)\# GC Handles" "\.NET CLR Memory(ProcessName)\# Gen 0 Collections" "\.NET CLR Memory(ProcessName)\# Gen 1 Collections" "\.NET CLR Memory(ProcessName)\# Gen 2 Collections" "\.NET CLR Memory(ProcessName)\# Induced GC" "\.NET CLR Memory(ProcessName)\# of Pinned Objects" "\.NET CLR Memory(ProcessName)\# of Sink Blocks in use" "\.NET CLR Memory(ProcessName)\# Total committed Bytes" "\.NET CLR Memory(ProcessName)\# Total reserved Bytes" "\.NET CLR Memory(ProcessName)\% Time in GC" "\.NET CLR Memory(ProcessName)\Allocated Bytes/sec" "\.NET CLR Memory(ProcessName)\Finalization Survivors" "\.NET CLR Memory(ProcessName)\Gen 0 heap size" "\.NET CLR Memory(ProcessName)\Gen 0 Promoted Bytes/Sec" "\.NET CLR Memory(ProcessName)\Gen 1 heap size" "\.NET CLR Memory(ProcessName)\Gen 1 Promoted Bytes/Sec" "\.NET CLR Memory(ProcessName)\Gen 2 heap size" "\.NET CLR Memory(ProcessName)\Large Object Heap size" "\.NET CLR Memory(ProcessName)\Promoted Finalization-Memory from Gen 0" "\.NET CLR Memory(ProcessName)\Promoted Finalization-Memory from Gen 1" "\.NET CLR Memory(ProcessName)\Promoted Memory from Gen 0" "\.NET CLR Memory(ProcessName)\Promoted Memory from Gen 1" "\Process(ProcessName)\% Privileged Time" "\Process(ProcessName)\% Processor Time" "\Process(ProcessName)\% User Time" "\Process(ProcessName)\Creating Process ID" "\Process(ProcessName)\Elapsed Time" "\Process(ProcessName)\Handle Count" "\Process(ProcessName)\ID Process" "\Process(ProcessName)\IO Data Bytes/sec" "\Process(ProcessName)\IO Data Operations/sec" "\Process(ProcessName)\IO Other Bytes/sec" "\Process(ProcessName)\IO Other Operations/sec" "\Process(ProcessName)\IO Read Bytes/sec" "\Process(ProcessName)\IO Read Operations/sec" "\Process(ProcessName)\IO Write Bytes/sec" "\Process(ProcessName)\IO Write Operations/sec" "\Process(ProcessName)\Page Faults/sec" "\Process(ProcessName)\Page File Bytes" "\Process(ProcessName)\Page File Bytes Peak" "\Process(ProcessName)\Pool Nonpaged Bytes" "\Process(ProcessName)\Pool Paged Bytes" "\Process(ProcessName)\Priority Base" "\Process(ProcessName)\Private Bytes" "\Process(ProcessName)\Thread Count" "\Process(ProcessName)\Virtual Bytes" "\Process(ProcessName)\Virtual Bytes Peak" "\Process(ProcessName)\Working Set" "\Process(ProcessName)\Working Set Peak" -si 15
@echo *** Counter created ***
@echo *** Starting logging ***
Logman.exe start Perf-Counter-Log
You can also list the counters in a separate text file and use:
 @echo off
@echo *** Creating counter ***
Logman.exe create counter Perf-Counter-Log -o "C:\PerfLogs\Perftest.blg" -f bin -v mmddhhmm -cf "DotNetMemory.txt" -si 15
@echo *** Counter created ***
@echo *** Starting logging ***
Logman.exe start Perf-Counter-Log
where the text file looks like this:
 "\.NET CLR Memory(ProcessName)\# Bytes in all Heaps"
"\.NET CLR Memory(ProcessName)\# GC Handles"
"\.NET CLR Memory(ProcessName)\# Gen 0 Collections"
"\.NET CLR Memory(ProcessName)\# Gen 1 Collections"
"\.NET CLR Memory(ProcessName)\# Gen 2 Collections"
"\.NET CLR Memory(ProcessName)\# Induced GC"
"\.NET CLR Memory(ProcessName)\# of Pinned Objects"
"\.NET CLR Memory(ProcessName)\# of Sink Blocks in use"
"\.NET CLR Memory(ProcessName)\# Total committed Bytes"
"\.NET CLR Memory(ProcessName)\# Total reserved Bytes"
"\.NET CLR Memory(ProcessName)\% Time in GC"
"\.NET CLR Memory(ProcessName)\Allocated Bytes/sec"
"\.NET CLR Memory(ProcessName)\Finalization Survivors"
"\.NET CLR Memory(ProcessName)\Gen 0 heap size"
"\.NET CLR Memory(ProcessName)\Gen 0 Promoted Bytes/Sec"
"\.NET CLR Memory(ProcessName)\Gen 1 heap size"
"\.NET CLR Memory(ProcessName)\Gen 1 Promoted Bytes/Sec"
"\.NET CLR Memory(ProcessName)\Gen 2 heap size"
"\.NET CLR Memory(ProcessName)\Large Object Heap size"
"\.NET CLR Memory(ProcessName)\Promoted Finalization-Memory from Gen 0"
"\.NET CLR Memory(ProcessName)\Promoted Finalization-Memory from Gen 1"
"\.NET CLR Memory(ProcessName)\Promoted Memory from Gen 0"
"\.NET CLR Memory(ProcessName)\Promoted Memory from Gen 1"
"\Process(ProcessName)\% Privileged Time"
"\Process(ProcessName)\% Processor Time"
"\Process(ProcessName)\% User Time"
"\Process(ProcessName)\Creating Process ID"
"\Process(ProcessName)\Elapsed Time"
"\Process(ProcessName)\Handle Count"
"\Process(ProcessName)\ID Process"
"\Process(ProcessName)\IO Data Bytes/sec"
"\Process(ProcessName)\IO Data Operations/sec"
"\Process(ProcessName)\IO Other Bytes/sec"
"\Process(ProcessName)\IO Other Operations/sec"
"\Process(ProcessName)\IO Read Bytes/sec"
"\Process(ProcessName)\IO Read Operations/sec"
"\Process(ProcessName)\IO Write Bytes/sec"
"\Process(ProcessName)\IO Write Operations/sec"
"\Process(ProcessName)\Page Faults/sec"
"\Process(ProcessName)\Page File Bytes"
"\Process(ProcessName)\Page File Bytes Peak"
"\Process(ProcessName)\Pool Nonpaged Bytes"
"\Process(ProcessName)\Pool Paged Bytes"
"\Process(ProcessName)\Priority Base"
"\Process(ProcessName)\Private Bytes"
"\Process(ProcessName)\Thread Count"
"\Process(ProcessName)\Virtual Bytes"
"\Process(ProcessName)\Virtual Bytes Peak"
"\Process(ProcessName)\Working Set"
"\Process(ProcessName)\Working Set Peak"
Cheers,
Andrea