What’s new for SQL Server vNext on Windows CTP 1.1 for Analysis Services
The public CTP 1.1 of SQL Server vNext on Windows is available here! This public preview includes the following enhancements for Analysis Services tabular.
- New infrastructure for data connectivity and ingestion into tabular models with support for TOM APIs and TMSL scripting. This enables:
- Support for additional data sources, such as MySQL. Additional data sources are planned in upcoming CTPs.
- Data transformation and data mashup capabilities.
- Support for BI tools such as Microsoft Excel enable drill-down to detailed data from an aggregated report. For example, when end-users view total sales for a region and month, they can view the associated order details.
- Enhanced support for ragged hierarchies such as organizational charts and chart of accounts.
- Enhanced security for tabular models, including the ability to set permissions to help secure individual tables.
- DAX enhancements to make DAX more accessible and powerful. These include the IN operator and table/row constructors.
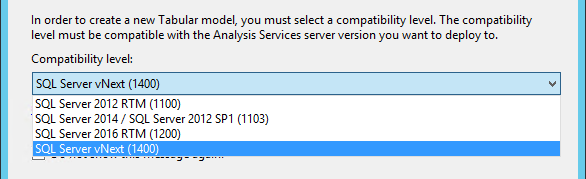
New 1400 Compatibility Level
SQL Server vNext CTP 1.1. for Analysis Services introduces the 1400 compatibility level for tabular models. To benefit from the new features for models at the 1400 compatibility level, you’ll need to download and install the December release of SSDT for CTP 1.1. In SSDT, you can select the new 1400 compatibility level when creating new tabular model projects. Models at the 1400 compatibility level cannot be deployed to SQL Server 2016 or earlier, or downgraded to lower compatibility levels.
Note that this SSDT Tabular release for CTP 1.1 is an early preview for evaluating the vNext capabilities of Analysis Services delivered with the 1400 compatibility level. It is not supported in production environments. Also, only install the Analysis Services, but not the Reporting Services and Integration Services components. Either install on a newly installed computer or VM or uninstall any previous versions first. Also, only work with Tabular 1400 models using this preview version of SSDT. For Multidimensional as well as Tabular 1100, 1103, and 1200 models, use SSDT version 16.5.
New Infrastructure for Data Connectivity
CTP1.1 release introduces a new infrastructure for data connectivity and ingestion into tabular models with support for TOM APIs and TMSL scripting. This is based on similar functionality in Power BI Desktop and Microsoft Excel 2016. There is a lot of information on this topic, so we have created a separate blog post here.
Detail Rows
A much-requested feature for tabular models is the ability to define a custom row set contributing to a measure value. Multidimensional models already achieve this by using the default drillthrough action. This allows end-users to view information in more detail than the aggregated level.
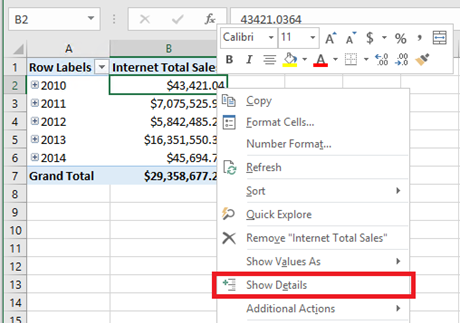
For example, the following PivotTable shows Internet Total Sales by year from the Adventure Works sample tabular model. Users can right-click the cell for 2010 and then select the Show Details menu option to view the detail rows.
By default, the associated data in the Internet Sales table is displayed. This behavior is often not meaningful to users because the table may not have the necessary columns to show useful information such as customer name and order information.
Detail Rows Expression Property for Measures
CTP1.1 introduces the Detail Rows Expression property for measures. It allows the modeler to customize the columns and rows returned to the end user.
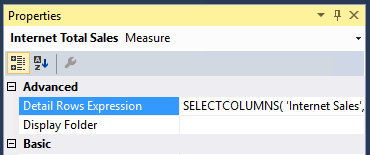
It is anticipated the SELECTCOLUMNS DAX function will be commonly used for the Detail Rows Expression. The following example defines the columns to be returned for rows in the Internet Sales table.
 SELECTCOLUMNS(
    'Internet Sales',
    "Customer First Name", RELATED(Customer[Last Name]),
    "Customer Last Name", RELATED(Customer[First Name]),
    "Order Date", 'Internet Sales'[Order Date],
    "Internet Total Sales", [Internet Total Sales]
)
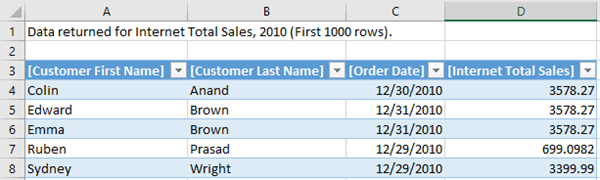
With the property defined and the model deployed, the custom row set is returned when the user selects Show Details. It automatically honors the filter context of the cell that was selected. In this example, only the rows for 2010 value are displayed.
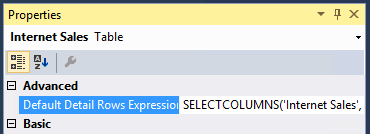
Default Detail Rows Expression Property for Tables
In addition to measures, tables also have a property to define a detail rows expression. The Default Detail Rows Expression property acts as the default for all measures within the table. Measures that do not have their own expression defined will inherit the expression from the table and show the row set defined for the table. This allows reuse of expressions, and new measures added to the table later will automatically inherit the expression.
DETAILROWS DAX Function
The DETAILROWS DAX function has been added in CTP1.1. The following DAX query returns the row set defined by the detail rows expression for the measure or its table. If no expression is defined, the data for the Internet Sales table is returned as it is the table containing the measure.
EVALUATE DETAILROWS([Internet Total Sales])
MDX DRILLTHROUGH statements – without a RETURN clause – are also compatible with detail rows expressions defined in tabular models.
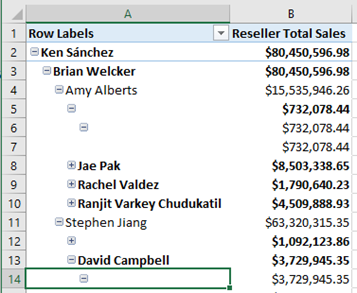
Ragged Hierarchies
As described in this article, Analysis Services tabular models can be used to model parent-child hierarchies. Hierarchies with a differing number of levels are referred to as ragged hierarchies. An example of a ragged hierarchy is an organizational chart. By default, ragged hierarchies are displayed with blanks for levels below the lowest child. This can look untidy to users, as shown by this organizational chart in Adventure Works:
CTP1.1 introduces the Hide Members property to correct this. Simply set the Hide Members property on the hierarchy to Hide blank members.
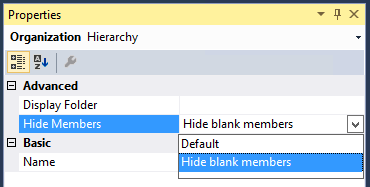
Note: It is necessary that the blank members in the model are represented by a DAX blank value, not an empty string.
With the property set and the model deployed, the more presentable version of the hierarchy is displayed.
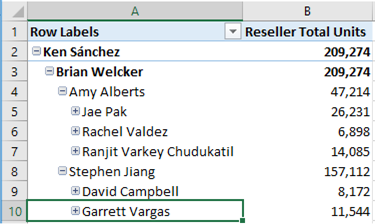
Table-Level Security
Roles in tabular models already support a granular list of permissions, and row-level filters to help protect sensitive data. Further information is available here.
CTP1.1 builds on this by introducing table-level security. In addition to restricting access to the data itself, sensitive table names can be protected. This helps prevent a malicious user from discovering that such a table exists.
The current version requires that a whole table’s metadata, and therefore all its columns, is set to be protected. Additionally, table-level security must be set using the JSON-based metadata, Tabular Model Scripting Language (TMSL), or Tabular Object Model (TOM).
The following snippet of JSON-based metadata from the Model.bim file helps secure the Product table in the Adventure Works sample tabular model by setting the MetadataPermission property of the TablePermission class to None.
 "roles": [
  {
    "name": "Users",
    "description": "All allowed users to query the model",
    "modelPermission": "read",
    "tablePermissions": [
      {
        "name": "Product",
        "metadataPermission": "none"
      }
    ]
  }
DAX Enhancements
CTP1.1 is compatible with the IN operator for DAX expressions. The TSQL IN operator is commonly used to specify multiple values in a WHERE clause. It feels natural to SQL Server database developers.
Prior to CTP1.1, it was common to specify multi-value filters using the logical OR operator or function. Consider the following measure definition.
 Filtered Sales:=CALCULATE(
    [Internet Total Sales],
    'Product'[Color] = "Red"
 || 'Product'[Color] = "Blue"
 || 'Product'[Color] = "Black"
)
This is simplified using the IN operator.
 Filtered Sales:=CALCULATE(
    [Internet Total Sales], 'Product'[Color] IN { "Red", "Blue", "Black" }
)
In this case, the IN operator refers to a single-column table with 3 rows; one for each of the specified colors. Note the table constructor syntax using curly braces.
The IN operator is functionally equivalent to the CONTAINSROW function.
 Filtered Sales:=CALCULATE(
    [Internet Total Sales], CONTAINSROW({ "Red", "Blue", "Black" }, 'Product'[Color])
)
We hope you will agree the IN operator used with table constructors is a great enhancement to the DAX language. MDX veterans should be jumping out of their seats with excitement at this point. The curly braces syntax should also feel natural to programmers of C based languages like C#, and Excel practitioners who use arrays. But wait, there’s more …
Consider the following measure to filter by combinations of product color and category.
 Filtered Sales:=CALCULATE(
    [Internet Total Sales],
    FILTER( ALL( Product[Color], Product[Product Category name] ),
        ( 'Product'[Color] = "Red"   && Product[Product Category Name] = "Accessories" )
     || ( 'Product'[Color] = "Blue"  && Product[Product Category Name] = "Bikes" )
     || ( 'Product'[Color] = "Black" && Product[Product Category Name] = "Clothing" )
    )
)
Wouldn’t it be great if we could use table constructors, coupled with row constructors, to simplify this? In CTP1.1, we can! The above measure is equivalent to the one below.
 Filtered Sales:=CALCULATE(
    [Internet Total Sales],
    FILTER( ALL( Product[Color], Product[Product Category name] ),
        ('Product'[Color], Product[Product Category Name]) IN
        { ( "Red", "Accessories" ), ( "Blue", "Bikes" ), ( "Black", "Clothing" ) }
    )
)
Lastly, it is worth pointing out that table and row constructors are independent of the IN operator. They are simply DAX table expressions. Consider the following DAX query.
 EVALUATE
UNION(
    ROW(
        "Value1", "Red Product Sales",
        "Value2", CALCULATE([Internet Total Sales], 'Product'[Color] = "Red")
    ),
    ROW(
        "Value1", "Blue Product Sales",
        "Value2", CALCULATE([Internet Total Sales], 'Product'[Color] = "Blue")
    ),
    ROW(
        "Value1", "Total",
        "Value2", CALCULATE([Internet Total Sales], 'Product'[Color] IN { "Red", "Blue" })
    )
)
In CTP1.1, it can be more simply expressed like this:
 EVALUATE
{
    ("Red Product Sales",  CALCULATE([Internet Total Sales], 'Product'[Color] = "Red")),
    ("Blue Product Sales", CALCULATE([Internet Total Sales], 'Product'[Color] = "Blue")),
    ("Total",              CALCULATE([Internet Total Sales], 'Product'[Color] IN { "Red", "Blue" }))
}
Download Now!
To get started, download SQL Server vNext on Windows CTP1.1 from here. SSDT for CTP1.1 available here. Be sure to keep an eye on this blog to stay up to date on Analysis Services.