Bucketing Values in DAX
Let’s say I wanted to analyze query performance on my SQL database. I have a log that has all the queries, the time it took them to run and the total records that were returned. I want to look at how the size of the results impacts the performance of the queries. I pull my data into Power Pivot and create a new pivot table where I put “Rows Returned” on rows and “Average Duration” in values. I get the following long results:
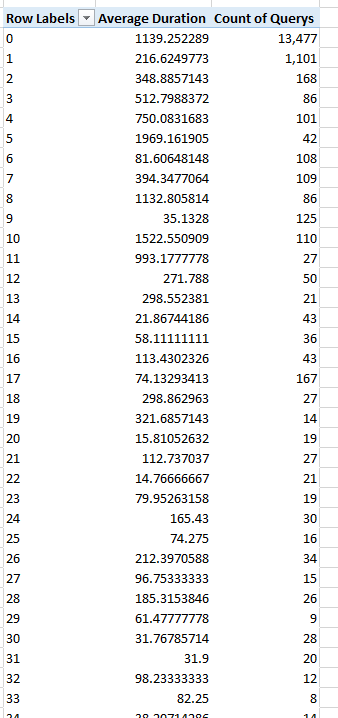
These results show me every unique number of rows that was returned and their average duration. The values returned for the “Rows Returned” field range between 0 and 172,028,053. I have added a measure with the query counts to the results showing the vast distribution of queries.
Since there are so many values of “Rows Returned” each individual average is not useful. What I really want to do is bucket the “Rows Returned” into groups and analyze the averages of each group. To do this. I take the following steps:
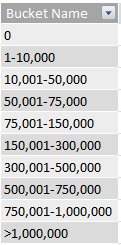
Create the following table in my Excel workbook:
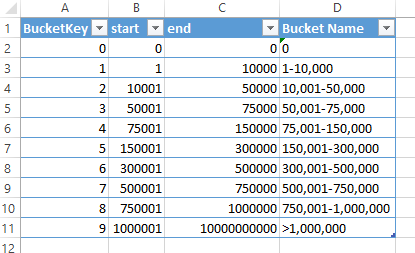
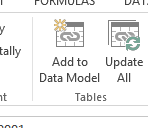
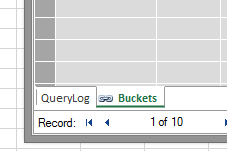
Add the table to my data model and call it “Buckets”
Add a new calculated column to my QueryLog table called “Row Range” with the following query:
“=CALCULATE(VALUES('Buckets'[Bucket Name]),filter('Buckets', 'Buckets'[start]<=[Rows Returned] && 'Buckets'[end]>=[Rows Returned]))”
Let’s break down this query a little for a single row:

VALUES('Buckets'[Bucket Name]) |
This will return all of the buckets names |
|
CALCULATE(…) |
Since we are only looking for one value for Bucket Name and don’t want the whole list, so we use CALCULATE to change the filter context. |
|
filter('Buckets',… && …) |
We want to filter the list by two different fields from the Bucket table, so we use the filter function inside of calculate as well as “&&” to specify an and condition. |
|
'Buckets'[start]<=[Rows Returned] |
Looks for all rows where the Start column is less than or equal to 515 (Rows Returned) |
|
&& 'Buckets'[end]>=[Rows Returned] |
And where End greater than or equal to 515 (Rows Returned) |
|
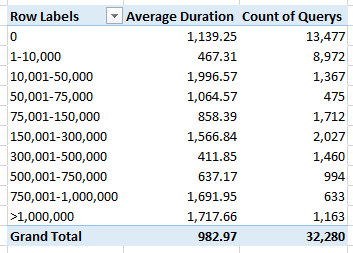
Now, when I go back to my pivot table I can use “Row Range” on rows and I get: