About the Relativity of Large Data Volumes
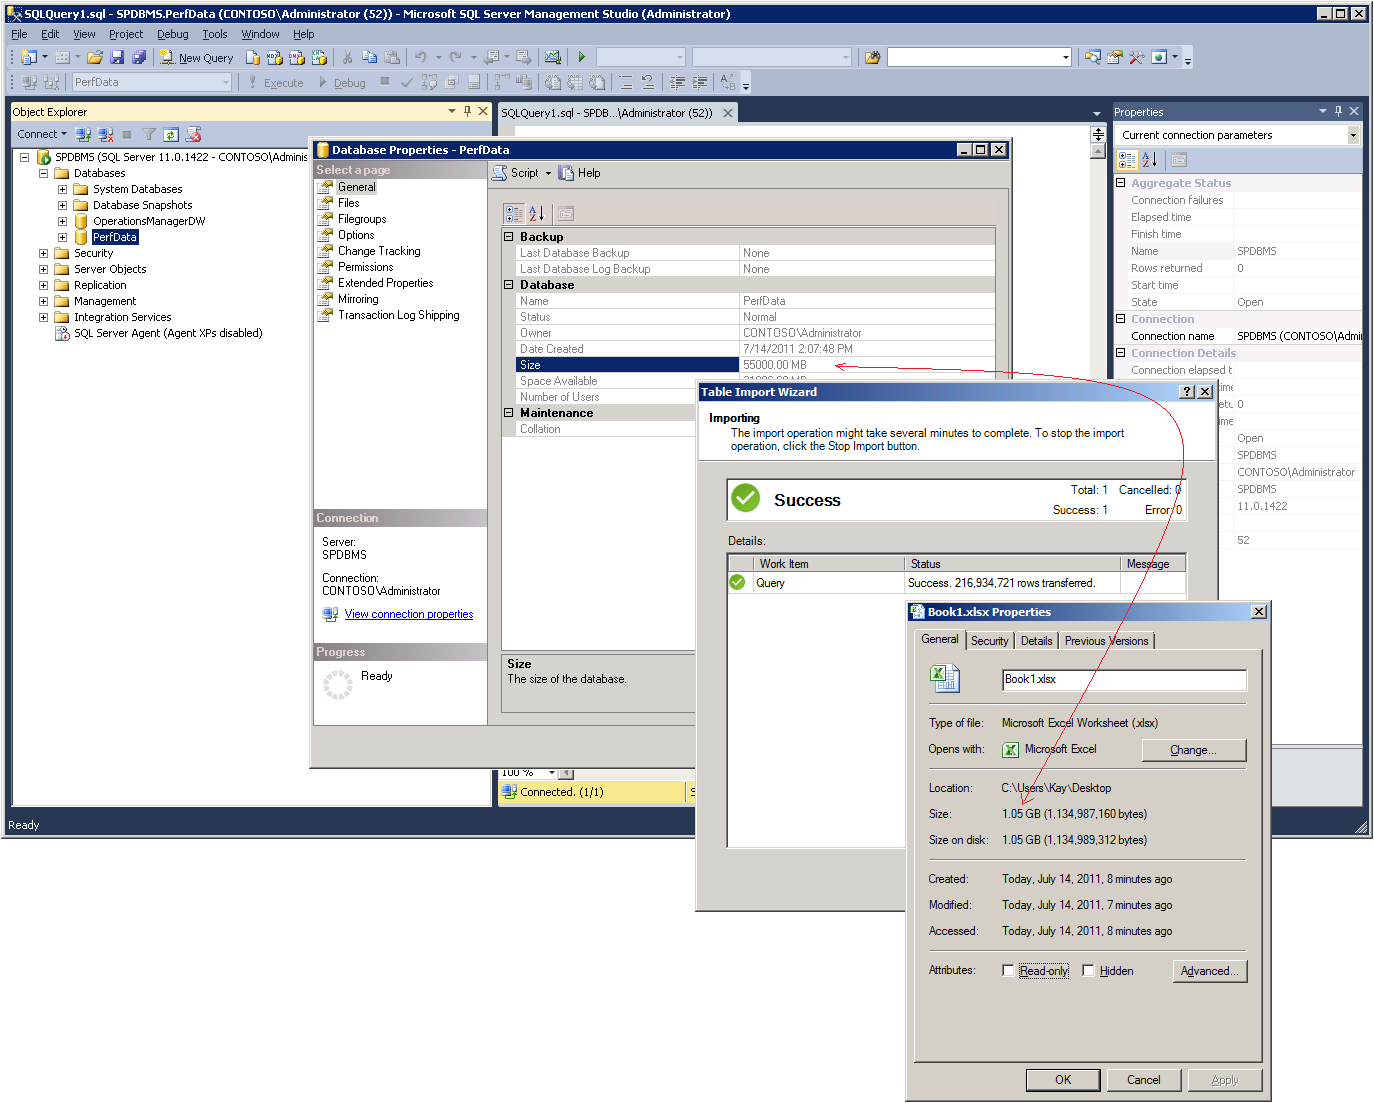
Some conversations in our team are really priceless. The other day, while working on an article about Analyzing Performance Data in PowerPivot, I was bragging to Ashvini about the fact that I was able to import a 55 GB database with more than 200 million rows of data into a 1 GB PowerPivot workbook, as illustrated in the following figure, and then I found myself flabbergasted when Ashvini asked back, “Why is this workbook so large?” – Clearly, the concept of large data volumes must be relative to the observer. So, let’s see why this workbook is so large and what we can do to deal with this data volume.
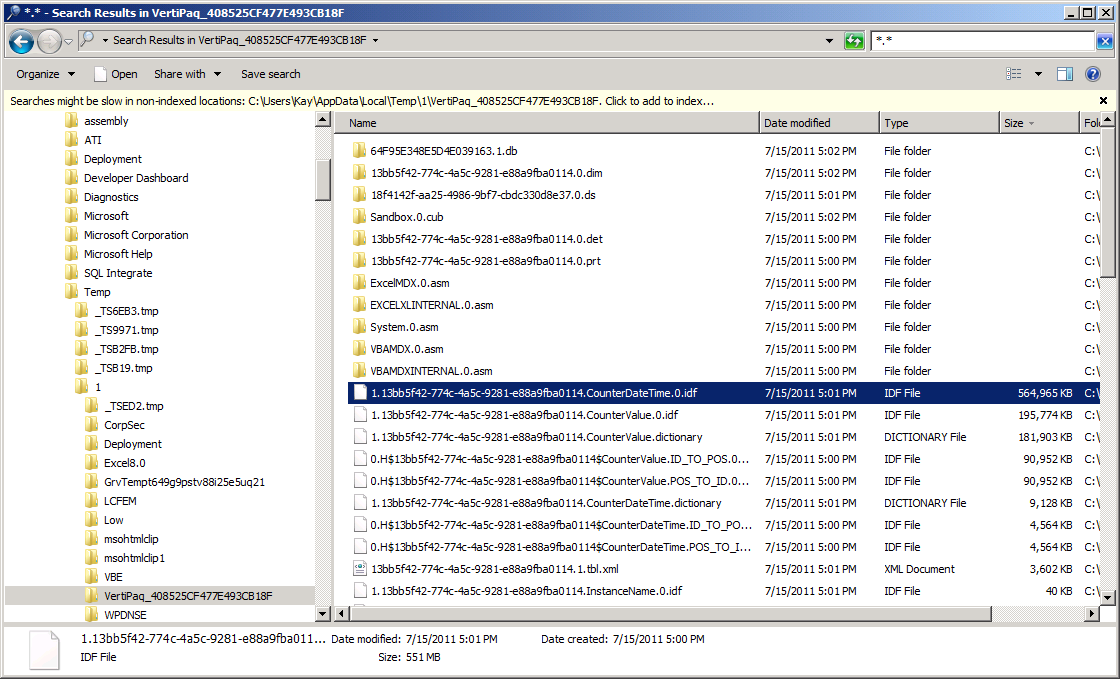
First of all, to find out what consumes the most space in a PowerPivot workbook, I recommend reading Denny’s classic article “Understanding why an Excel PowerPivot workbook is so large” at https://powerpivottwins.com/2009/11/07/understanding-why-an-excel-powerpivot-workbook-is-so-large/. Following Denny’s suggestions, I opened my workbook, ran the command explorer %TEMP% to navigate to the Temp folder in Windows Explorer, and then within the Temp folder, I searched the most recent VertiPaq _<GUID> folder for all the temporary data files (*.*). The Analysis Services engine, running within the Excel client process, creates these temporary files when loading the PowerPivot database. As the following screenshot reveals, the largest temporary file with over 500 MB was called 1.13bb5f42-774c-4a5c-9281-e88a9fba0114.CounterDateTime.0.idf, which pointed me to the CounterDateTime column.
The reason for the CounterDateTime column to consume so much space can be tracked back to the data import query:
SELECT CONVERT(DATETIME, CAST(CounterDateTime AS VARCHAR(19))) AS CounterDateTime,
MachineName, ObjectName, CounterName, InstanceName, CounterValue
FROM PerfData.dbo.CounterData JOIN
PerfData.dbo.CounterDetails ON CounterData.CounterID = CounterDetails.CounterID JOIN
PerfData.dbo.DisplayToID ON CounterData.GUID = DisplayToID.GUID
The T-SQL expression CONVERT(DATETIME, CAST(CounterDateTime AS VARCHAR(19))) AS CounterDateTime takes 19 characters from the CounterDateTime column in the PerfData.dbo.CounterData source table and converts the resulting string into a DATETIME value (such as, 2011-04-02 14:13:49). The result is precise to a second and at this level of precision, my source column includes 1,168,290 unique values, as the DistinctCounterDateTime Values measure in the following screenshot attests.

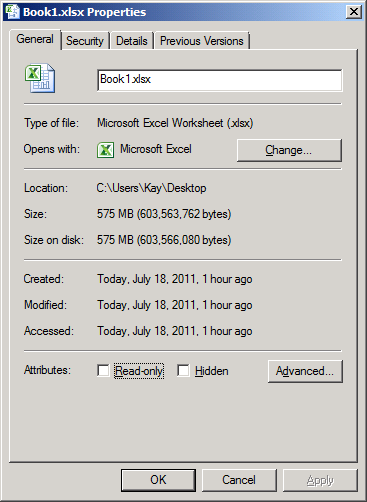
By reducing the precision to minutes, the number of unique values drops by roughly a factor of 60 (1,168,290 / 60 = 19,471.5). One way to do this is to reduce the VARCHAR length to 16 characters (CAST(CounterDateTime AS VARCHAR(16)) in the import query. Another is to convert the string to a SMALLDATETIME instead of a DATETIME value. The choice depends on whether you want to truncate the seconds or round the result to the nearest minute. Either way, the unique count dropped in my example to 19,492 values, which provides for much better compressibility over more than 200 million rows than 1,168,290 unique values. In fact, the gain in compressibility helped me to bring the workbook size down to 575 MB, as you can see in the following screenshot. The tradeoff: I can no longer analyze the imported data at the level of seconds, but I didn’t drop any performance counter values, so I still can aggregate the data for each individual minute by using SUM, MIN, MAX, AVERAGE, etc. For my purposes, this is acceptable.
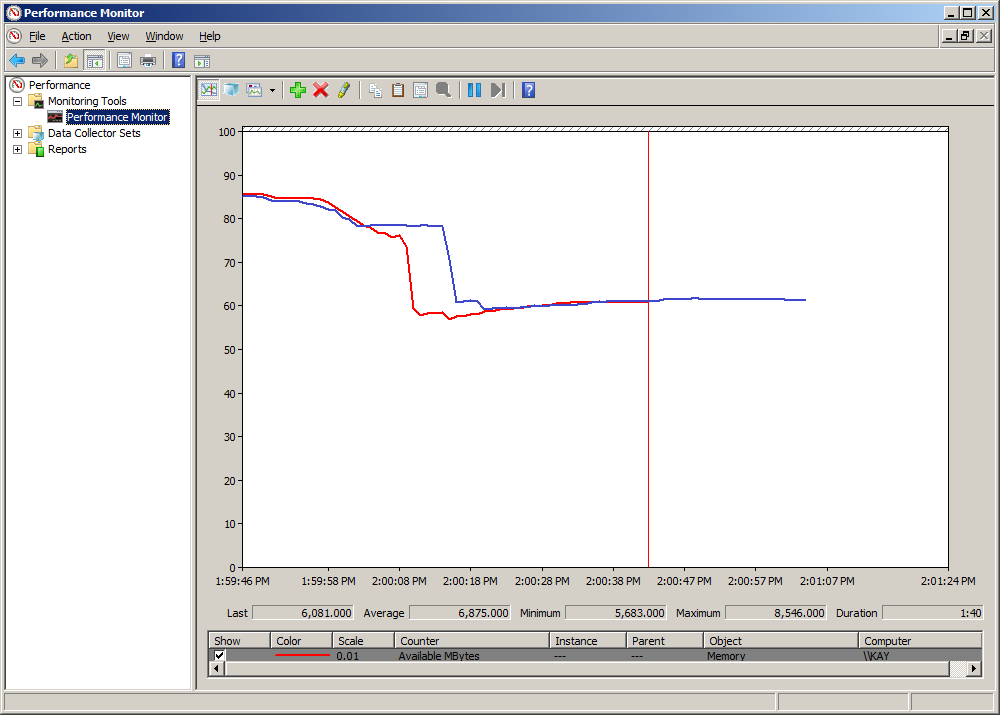
Reducing the workbook size is great. Among other things, smaller workbooks are easier to handle when uploading to SharePoint. However, it is important to note that the workbook size does not necessarily reflect the size of the PowerPivot database in memory. You can verify this by using Performance Monitor. Just track the Available Mbytes counter for the Memory object when opening the workbook. The following figure shows two Performance Monitor graphs on top of each other. The blue line corresponds to the optimized 575 MB workbook and the red is the original 1 GB workbook. As you can see, both workbook versions consume exactly the same amount of memory, approximately 2.5 GB.
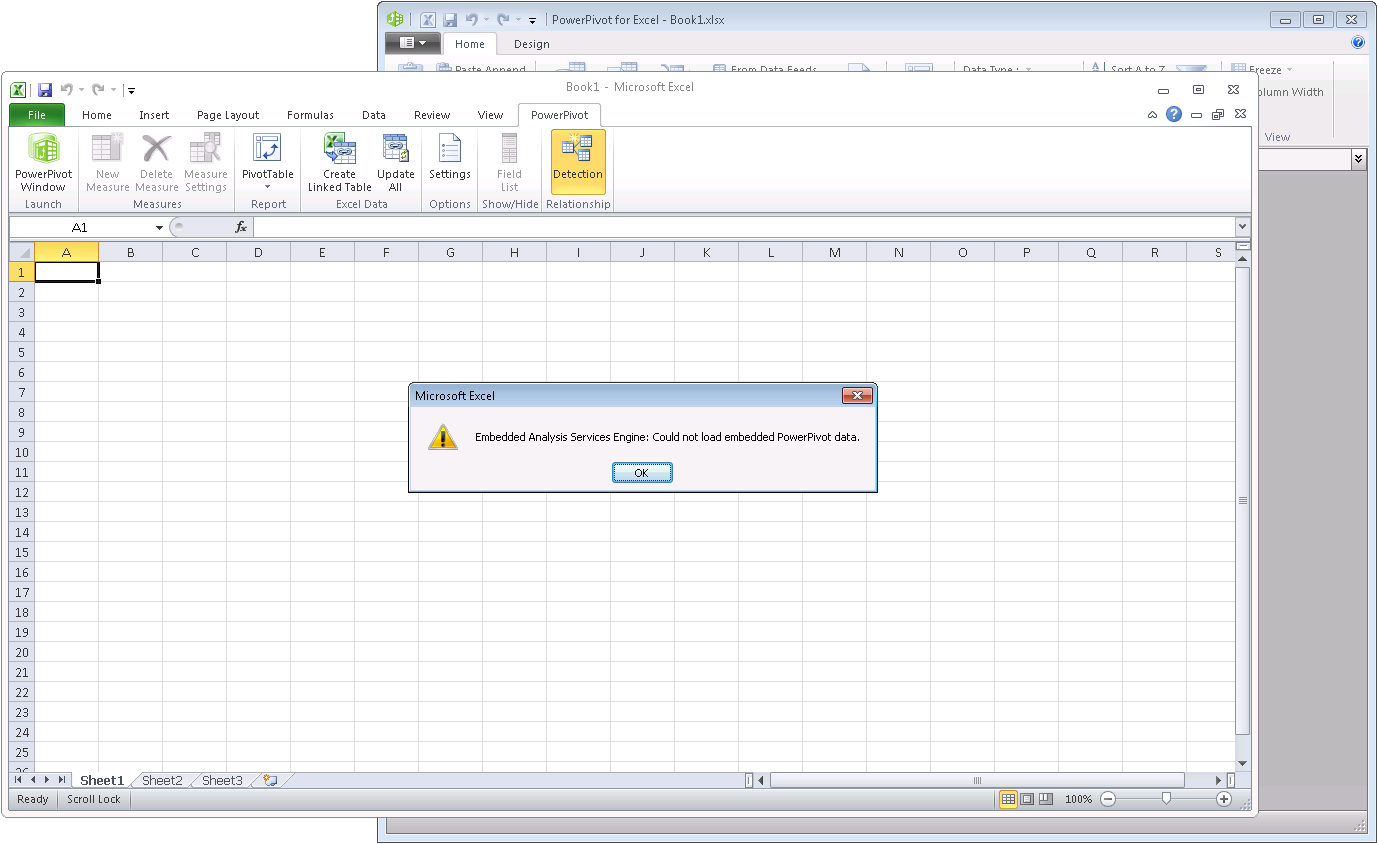
Going back to the relativity of large data volumes, a PowerPivot workbook consuming 2.5 GB in memory might not be an issue for users running 64-bit Excel clients, but 32-bit clients see this very differently. Given that all PowerPivot data must fit into memory, 2.5 GB of PowerPivot data is simply too large for 32-bit clients. It’s a straightforward calculation: 232 bits gives you an addressable space of 4 GB; the operating system reserves 2 GB for the kernel; Excel client, Analysis Services engine, any further add-ins plus the Excel data structures for the workbook itself (such as, cell data and pivot cache) consume some of the remaining 2 GB, leaving perhaps 1-1.5 GB of virtual memory to load PowerPivot data. So, a 32-bit client can absolutely not load a 2.5 GB database. The user gets an error message, as in the following screenshot. If your users regularly exceed the 32-bit memory limitation with their PowerPivot workbooks, I recommend deploying 64-bit Excel 2010 and PowerPivot throughout your organization. It will noticeably improve the user experience, avoid frustrated helpdesk calls, and increase the productivity of your information workers overall.
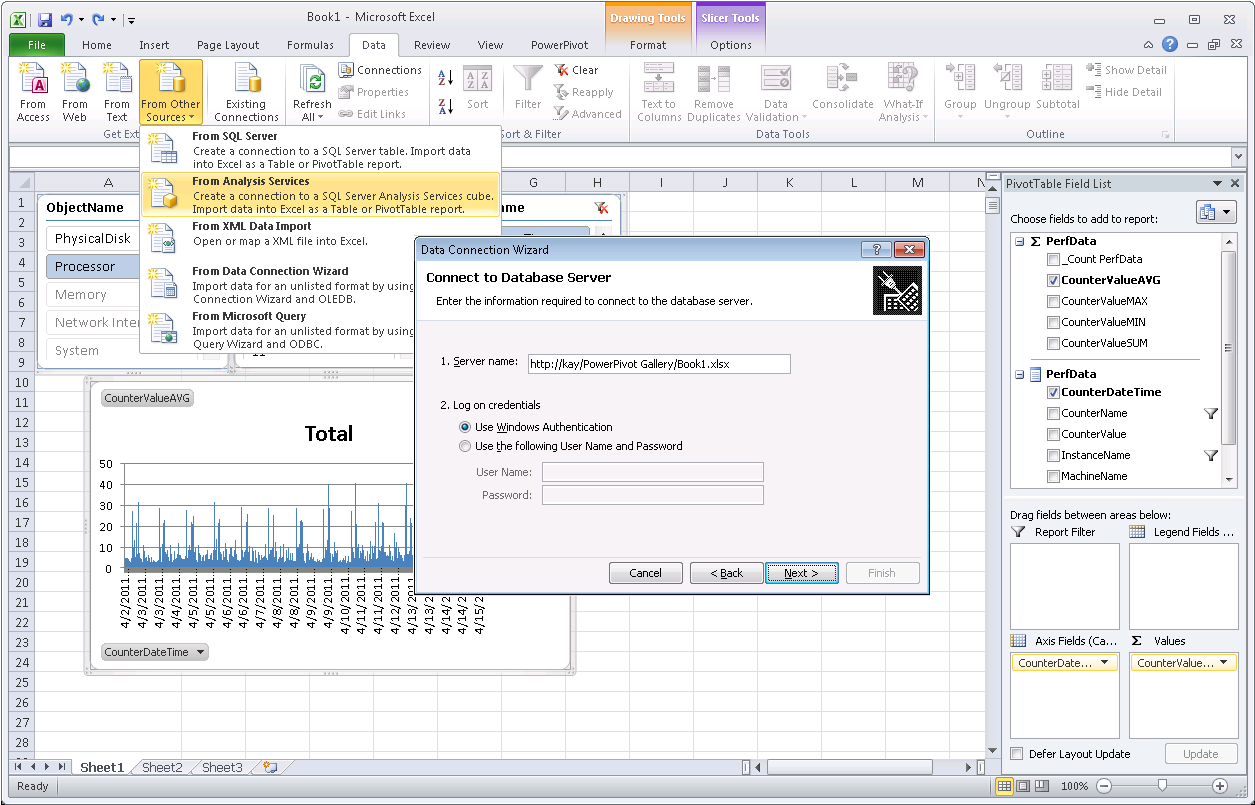
No doubt, 64-bit Excel 2010 with PowerPivot is great, but not all organizations can justify an upgrade to 64-bit clients in one big all-encompassing swoop. Don’t despair, PowerPivot for SharePoint 2010 can help. If the desktop client cannot load the PowerPivot workbook, publish the workbook in SharePoint and open it in a Web browser or link to it from within your 32-bit Excel client as if it was an Analysis Services database. The following screenshot shows you a 32-bit Excel client happily analyzing my 575 MB PowerPivot workbook with 216 million rows of data. It works because the client doesn’t load the embedded database. It’s loaded on a PowerPivot application server. If you are interested in an introduction to the PowerPivot for SharePoint architecture and the technical details around linking to published workbooks as a data source, check out Lee’s excellent 4-part video series titled “PowerPivot for SharePoint Architecture,” particularly “Part 4: Using PowerPivot Workbooks as a Data Source,” available on the TechNet Wiki at https://social.technet.microsoft.com/wiki/contents/articles/powerpivot-for-sharepoint-architecture.aspx.
Note: In order to prepare my large PowerPivot workbook for consumption as a data source, I explicitly added the measures CounterValueSUM, CounterValueMIN, CounterValueMAX, and CounterValueAVG to the workbook, similar to the DistinctCounterDateTime Values measure displayed in a screenshot earlier in this article. The CounterValueSUM, CounterValueMIN, CounterValueMAX, and CounterValueAVG measures are very straightforward based on the corresponding DAX functions SUM, MIN, MAX, and AVERAGE over the CounterValue column in my PerfData table. |
You might have guessed it; SharePoint adds yet another dimension to the relativity of large data volumes. Large files with hundreds of megabytes inflate the size of SharePoint content databases and might require a re-evaluation of BLOB storage options and backup and recovery procedures. This isn’t necessarily a favorite pastime of SharePoint administrators. In order to keep content databases under control, it is not uncommon for large SharePoint farms to enforce upload limits far below 500 MB. So, uploading 575 MB or even larger workbooks might not always be possible.
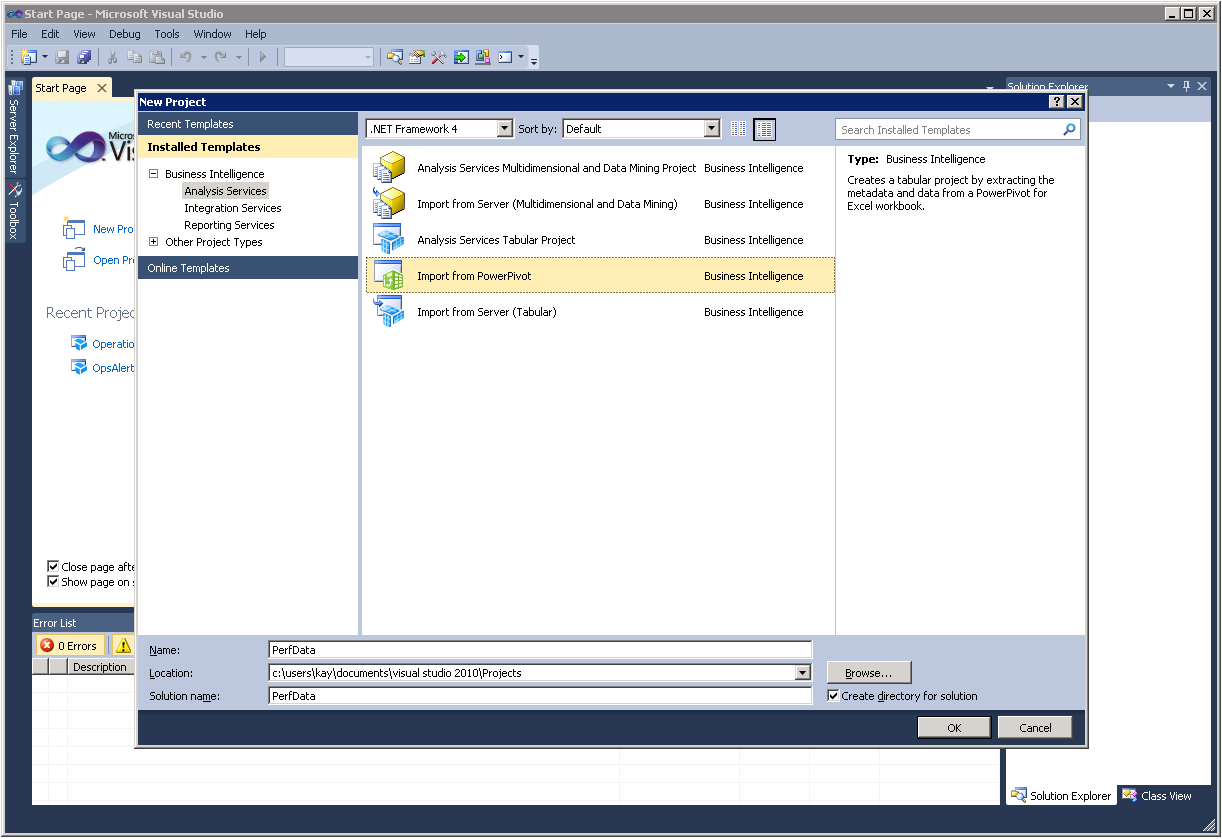
If you find yourself without a suitable SharePoint environment to make your large workbooks accessible to 32-bit Excel users, you could consider deploying SQL Server code-named “Denali.” The Denali version of Analysis Services supports tabular models that are similar to PowerPivot models but with more capabilities. In fact, it is very easy to migrate a PowerPivot workbook to a tabular model. Just start Business Intelligence Development Studio (BIDS), create a new project, and select Import from PowerPivot as the project type, as the following screenshot illustrates. Tabular models are only limited by the physical amount of memory available on the SSAS server. So, now your users can access large data volumes by means of a genuine Analysis Services database and, all of a sudden, 1 GB of data doesn’t seem quite so big anymore at all. For more information about tabular models, read Cathy’s recent blog post “Welcome to Tabular Projects.”
On the other hand, if you don’t have Denali yet, you might have to go the extra mile to reduce the data in the PowerPivot database further. This isn’t as bad as it sounds. In fact, it is quite positive as smaller workbooks load faster, consume less space on disc and in memory, and are just easier to handle on 32-bit and 64-bit workstations. In my example, I decided to reduce the data volume by aggregating the data in the relational database based on the following T-SQL batch prior to importing the data into PowerPivot.
SELECT CONVERT(DATETIME, CAST(CounterDateTime AS VARCHAR(16))) AS CounterDateTime,
MachineName, ObjectName, CounterName, InstanceName, CounterValue
INTO PerfData.dbo.TruncatedCounterData
FROM PerfData.dbo.CounterData JOIN
PerfData.dbo.CounterDetails ON CounterData.CounterID = CounterDetails.CounterID JOIN
PerfData.dbo.DisplayToID ON CounterData.GUID = DisplayToID.GUID
SELECT CounterDateTime,
AVG(CounterValue) as CounterValueAVG,
MIN(CounterValue) as CounterValueMIN,
MAX(CounterValue) as CounterValueMAX,
SUM(CounterValue) as CounterValueSUM,
MachineName, ObjectName, CounterName, InstanceName
INTO PerfData.dbo.AggregatedCounterData
FROM PerfData.dbo.TruncatedCounterData
GROUP BY CounterDateTime, MachineName, ObjectName, CounterName, InstanceName
The first SELECT statement converts the CounterDateTime values into the desired DATETIME format and writes the results into a TruncatedCounterData table. The second SELECT statement then aggregates the data and puts the results into an AggregatedCounterData table. PowerPivot then imports the data directly from the AggregatedCounterData table. My PowerPivot database now only contains 3,625,067 rows and consumes 537 MB in memory, as the following screenshot reveals. This is a size both 32-bit and 64-bit clients can handle. And the workbook size dropped to 94.2 MB, which makes it possible to share this workbook even in a SharePoint farm with very restrictive upload limits. Moreover, because PowerPivot has significantly fewer rows to scan, the solution is faster and more convenient to use.

In conclusion, putting a 55 GB database into a 1 GB PowerPivot workbook might be an impressive achievement, but it’s still a good idea to look at the result with a critical eye and keep asking the question “Why is this workbook so large?” Perhaps a tabular model is more suitable for the intended purpose than a PowerPivot workbook, or perhaps there are more opportunities to reduce the data volume. With the right preparations in the data source, a 55 GB database might very well fit into a 100 MB PowerPivot workbook without sacrificing analyzability of the data. Smaller workbooks load faster, consume less space on disc and in memory on 32-bit and 64-bit workstations, and are easier to share in SharePoint. I hope you enjoyed this little excursion into the relativity of large data volumes.