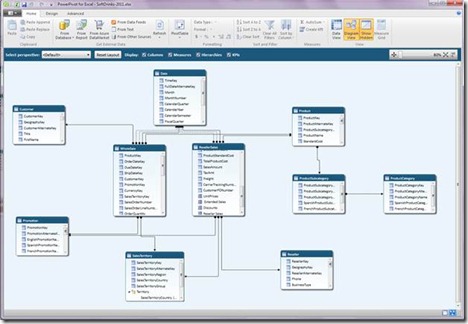
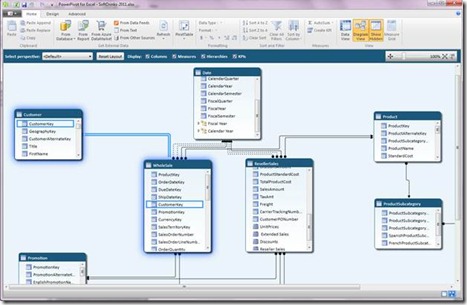
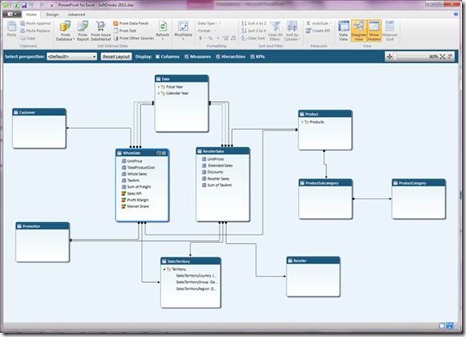
The Diagram is here…
Probably one of the most frequently requested features we have had for PowerPivot V1 has been the request for a Diagram. As a result we are super excited that the Diagram View found its way through with CTP3 ![]()
The Diagram View is - as the name suggests - basically a diagrammatic view of the model. This means that in CTP3 you will have two views available when working with your models:
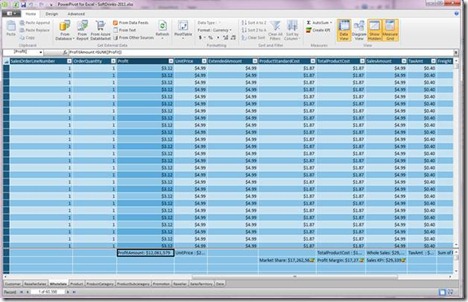
· The Data View, representing the data grid you may know from PowerPivot V1 where you work directly with the data that resides in your tables
· The new Diagram View, representing the metadata view of your model for viewing and defining your model at an object level.
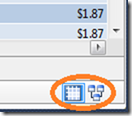
The Diagram View is available for both the Tabular project types in BIDS as well as for PowerPivot. The entry points for the two views can be found in the lower right hand corner of the modeling window as show below.
We aimed at having feature parity between the two views for the most common operations such as hide, rename and delete in order to prevent frequent switching between the two views. However, given the fact that one view represents data and other metadata there are obviously some tasks that do lent themselves better to be performed in one view versus the other. So there are some key differences in terms of modeling capabilities that are worth pointing out.
Features Specific to Data View
All data enriching operations using DAX such as adding calculated columns and defining measures are available in the Data View only. The same counts for creation of KPIs, which are directly tied to existing measures.
In future versions this may change, but for Denali we made the choice to only add these data driven operations to the Data View where the direct access to the data makes it very easy to verify the operations as they are performed. Other options where interactivity with the data is an advantage, such as sort and filter are also available in the Data View only.
Features specific to Diagram View
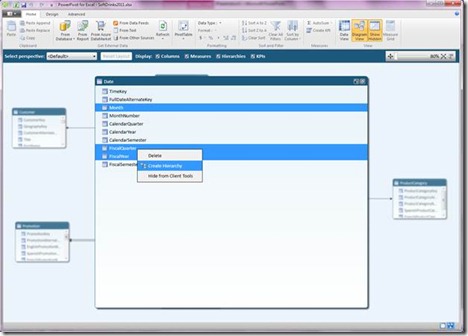
Creation of user defined hierarchies is a feature that you will find in the Diagram View only. It’s a metadata driven operation, which simply made more sense in the Diagram, where each table is used as modeling surface for creating and editing the hierarchies.
Interacting with the Diagram
The Diagram is more than just a view that provides a great overview of the tables and relationship, though. It’s a fully-fledged designer, which allows for greater interactivity and navigation across the entire model.
So despite the fact that most operations (the exceptions outlined above) can be performed in either view it’s easy to imagine that many BI professionals will spend the majority of the time modeling from within the Diagram. Let’s take a closer look at the Diagram:
Creating Relationships
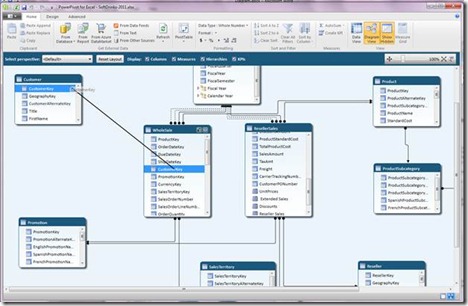
You will often see the Diagram referenced as the Entity Relationship (ER) Diagram. So yes, you can obviously create relationships from the Diagram View. You can either use drag and drop of columns or use the table or column context menu to launch the Create Relationship dialog box.
When you mouse over an existing relationship the primary and foreign key tables and columns will light up for greater visibility. See above. This is particular useful when your model is zoomed out and a large number of tables makes the relationship lines more challenging to follow.
To edit a relationship you simply double click the relationship line on the Diagram surface.
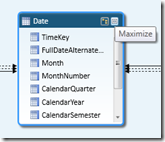
Maximizing tables
You have the ability to maximize each table. The idea here is to provide a better modeling surface as you work with each table. When in maximized state only the particular tables active and the rest of the diagram is disabled
Creating Hierarchies
As mentioned earlier the Diagram View is where you will be creating user defined hierarchies. Hierarchies can be created either by using the column context menu or by using the Create Hierarchy button in the table header.
Using Display Filters
The Display Filters are located at the tool bar at the top of the Diagram.
They can be used for filtering out the different object types from the tables in the Diagram allowing you to narrow down your view to only display particular objects. The Display Filters are in particular use when working with larger models helping you better navigate your model.
Leveraging Perspectives
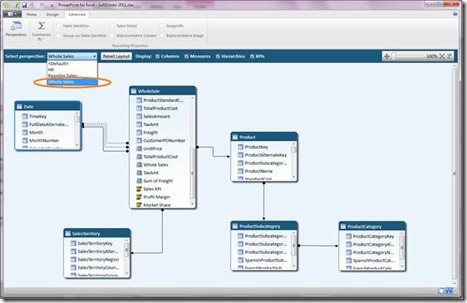
Another way to narrow down the view of your model is to use the Perspective selection. Perspectives are designed to enable you to define subsets of the model that represents only most relevant parts of a model to end users as they consume the model via client tools. However, once the perspectives are created you, as a model designer can also leverage the perspectives to narrow down the number of objects in the Diagram providing a simplified view of the model at design time.
Navigating using the Go to option
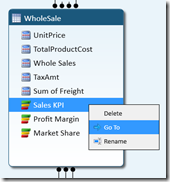
The Go To option is located in the context menu of every object that exists in both the Diagram and the Data view.
The Go To option will take you to the same object in the Data View allowing you an easy navigation path to exploring the data behind each object.
Obviously there are a lot more features available in the Diagram overall and as mentioned you will find (almost) all the features that exists in the Data View in the Diagram as well. But hopefully this post gives you a taste of what the Diagram will provide!
Enjoy your modeling using CTP3!
