Analyzing Performance Data in PowerPivot
PowerPivot is an absolutely fantastic performance analysis tool. You might say that I’m biased, but wait until you see firsthand how easy it is to analyze large amounts of performance data from any number of computers. For example, I recently had to analyze resource utilization in a SharePoint farm with 16 front-end servers, 8 Excel Services application servers, 4 PowerPivot application servers, and 2 content database servers. Each load test sampled a variety of performance counters from all of these servers in one-second intervals and generated over 250 million rows of data, and I needed to analyze this data for individual servers as well as for server roles. Sounds like a lot of work? Piece of cake if you use PowerPivot! Here are the steps:
- Configure a user-defined data collector in Performance Monitor to track selected performance counters in a relational database, then run your load test.
- Import the performance data from the relational database into a PowerPivot workbook.
- Create PivotTables and PivotCharts as necessary to analyze your performance data based on individual servers as well as based on server roles.
Point 1 is by far the most work-intensive step—especially if you have to configure Performance Monitor on some 30 or more servers. As a prerequisite, you must create a relational database on a central SQL server. Let’s call it PerfData. You also need to create a System Data Source Name (DSN) on every computer running Performance Monitor, pointing to the PerfData database. You can simplify this configuration task by importing the following .reg file content into your computers’ registry. Just make sure you replace <Server Name> with the name of your SQL server hosting the PerfData database. Use two backslashes as a separator if you must specify server and instance names, such as SERVER\\POWERPIVOT.
Windows Registry Editor Version 5.00
[HKEY_LOCAL_MACHINE\SOFTWARE\ODBC\ODBC.INI]
[HKEY_LOCAL_MACHINE\SOFTWARE\ODBC\ODBC.INI\ODBC Data Sources]
"PerfDSN"="SQL Server"
[HKEY_LOCAL_MACHINE\SOFTWARE\ODBC\ODBC.INI\PerfDSN]
"Driver"="C:\\Windows\\system32\\SQLSRV32.dll"
"Server"=" <Server Name> "
"Database"="PerfData"
"Trusted_Connection"="Yes"
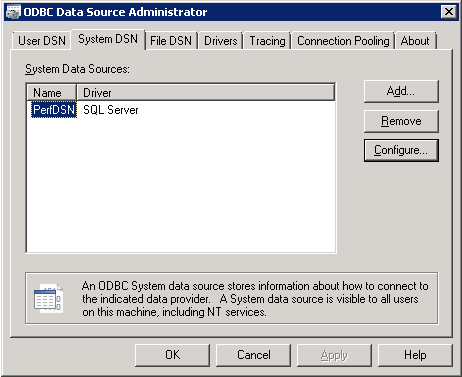
Having imported the .reg file content into the registry, you can verify the presence of the System DSN called PerfDSN by using ODBC Data Source Administrator, which is available in the Control Panel under Administrative Tools.
The next step is to create a data collector in Performance Monitor, which uses the PerfDSN to connect to the PerfData database. Again, it’s best to automate this configuration task, this time by means of an XML template and a batch file. A sample XML template is attached to this blog post. The batch file has the following content (make sure you replace the user account and server names with actual information and add further lines as necessary).
logman import "PerfCollector" -xml "Template.xml" -u contoso\administrator p@ssword1 -s SERVER01
logman import "PerfCollector" -xml "Template.xml" -u contoso\administrator p@ssword1 -s SERVER02
Note that the specified user account requires write permissions to the PerfData database. Performance Monitor uses this account to write the performance counter values. Of course, it’s a good idea to test the configuration:
- Start Performance Monitor from the Administrative Tools.
- Expand Data Collector Sets, expand User Defined, select PerfCollector, right-click PerfCollector, and then click Start.
- Verify that the PerfCollector starts successfully.
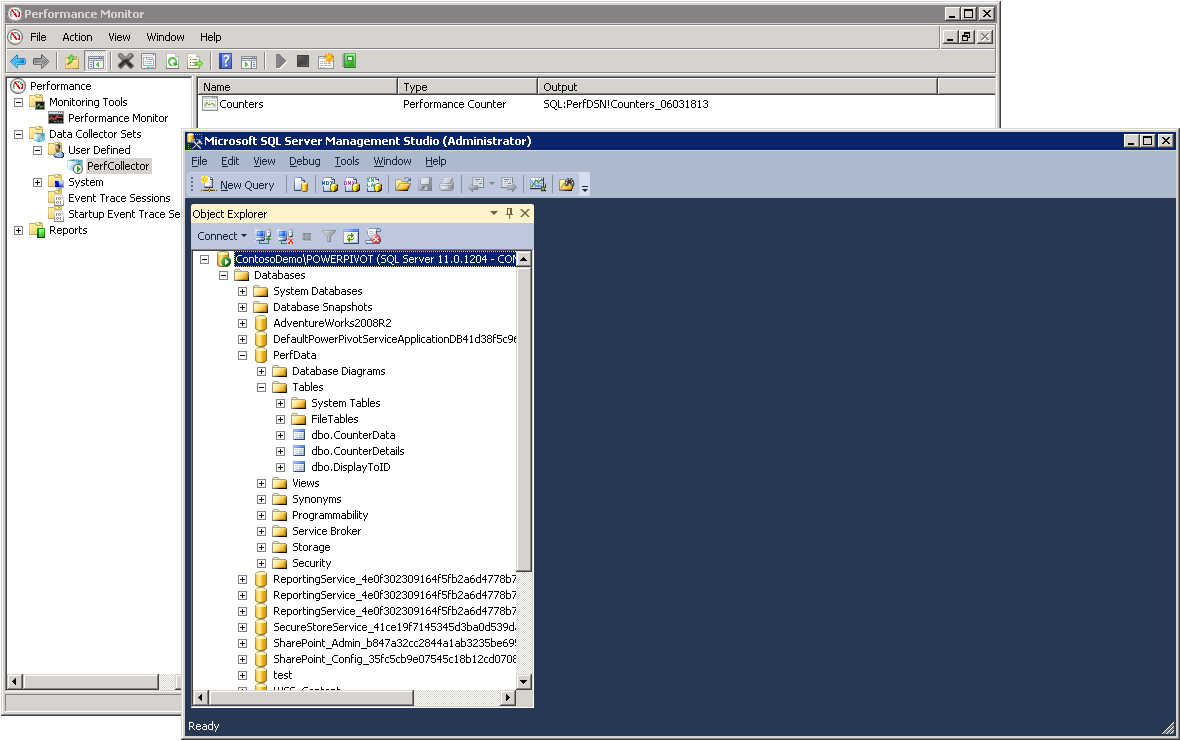
- Check the PerfData database in SQL Server Management Studio. Performance Monitor creates three tables called CounterData, CounterDetails, and DisplayToID to log performance data.
- Stop Performance Monitor again.
Tip: If Performance Monitor does not start the PerfCollector successfully, then either your PerfDSN configuration is incorrect (use ODBC Data Source Administrator to adjust the configuration) or the account you specified for the PerfCollector doesn’t have the required permissions (edit the PerfCollector properties in Performance Monitor and specify a different account under Run As on the General tab).
The performance data gathering system is almost complete. An optional but very useful piece is a batch file to start and stop the PerfCollector on all test machines. The following batch can serve as a starting point. Just make sure you replace SERVER01 and SERVER02 with actual computer names, and add start and stop commands for further computers as necessary. The batch expects a command-line argument, which specifies the number of minutes to run the PerfCollector on the specified computers. It automatically stops the data collection when the specified time has elapsed and ensures in this way that no PerfCollector instances are left running. This helps to avoid flooding the PerfData database.
@echo off
setlocal ENABLEDELAYEDEXPANSION
REM Start the PerfCollector on all servers
@echo on
logman start "PerfCollector" -s SERVER01 -as
logman start "PerfCollector" -s SERVER02 -as
@echo off
REM Set start and end time for performance data collection
set /A Start=1
set /A End=%1
REM Loop for the specified number of minutes
:LOOP
if !Start! gtr !End! GOTO LOOP_END
choice /d y /t 60 > nul
set /A Start+=1
goto LOOP
:LOOP_END
@echo on
logman stop "PerfCollector" -s SERVER01 -as
logman stop "PerfCollector" -s SERVER02 -as
The hard work is done, but before moving on to PowerPivot let’s briefly discuss why you need the PerfData database. After all, Performance Monitor could also write the data to comma- or tab-separated text files. The most obvious disadvantage of text files, however, is that it takes a very long time to import any number of them, especially if you want to import hundreds of millions of rows into PowerPivot. Another significant disadvantage is that the text files tend to be extremely wide. Performance Monitor tracks every selected performance counter in a separate column. For example, the PerfCollector template includes approximately 200 counters, which would imply that PowerPivot ends up with very wide tables. Wide tables increase metadata overhead and decrease storage efficiency. Furthermore, the column names are not intuitive as they include the server name, performance object, and counter name separated by backslashes. Cleaning this up for 200 columns is just too much work. Moreover, text files contain counter values as strings. You’d have to convert them into DateTime and decimal numbers after the import. Again, a tedious task for 200 columns, so don’t torture yourself and just use a SQL Server database.
Now, let’s have some fun with performance data:
Run the PerfCollector for a few minutes to gather some data, then start Excel 2010 on your workstation, and display the PowerPivot window.
Click From Database and select From SQL Server.
In the Table Import Wizard, under Server Name, specify the name of the SQL server hosting the PerfData database. Under Database Name, type PerfData, and then click Next.
Select Write a query that will specify the data to import, and then click Next.
On the next wizard page, in the SQL Statement box, paste the following query:
SELECT CONVERT(DATETIME, CAST(CounterDateTime AS VARCHAR(19))) AS CounterDateTime,
MachineName, ObjectName, CounterName, InstanceName, CounterValue
FROM PerfData.dbo.CounterData JOIN
PerfData.dbo.CounterDetails ON CounterData.CounterID = CounterDetails.CounterID JOIN
PerfData.dbo.DisplayToID ON CounterData.GUID = DisplayToID.GUIDClick Validate to verify that the SQL statement is syntactically correct and then click Finish.
Observe that PowerPivot imports the data successfully and then click Close.
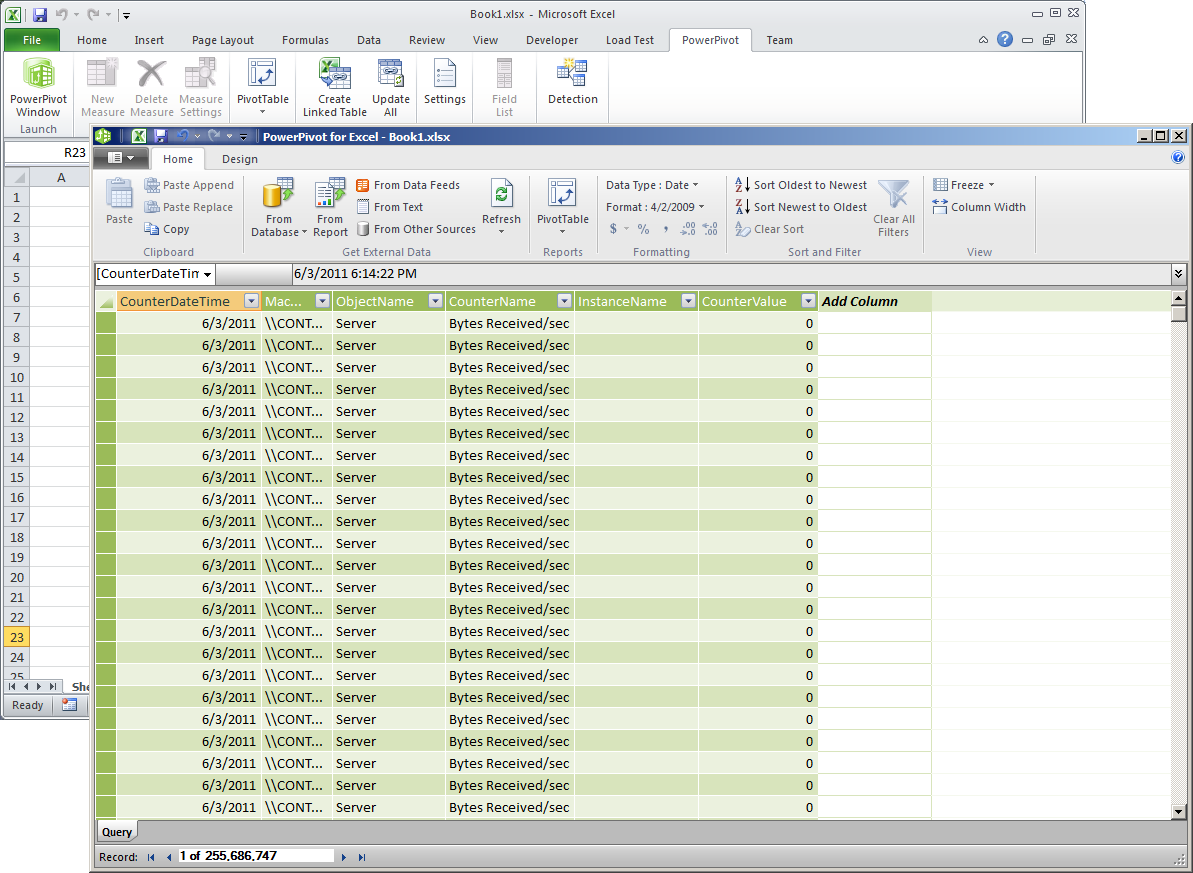
If desired, rename the table to PerformanceData. This is about all it takes to prepare the data for basic analysis:
- Switch to the Excel window, and then on the PowerPivot ribbon, in the Report section, click on the little triangle underneath PivotTable. Select the PivotChart option.
- In the Create PivotChart dialog box, select Existing Worksheet, and then click OK.
- PowerPivot places an empty chart on the worksheet. Select the chart and then, in the PowerPivot Field List to the right, drag the following fields to the field areas:
Field Area |
Fields |
∑ Values: |
CounterValue (automatically changes to Sum of CounterValue) |
Axis Fields (Categories): |
CounterDateTime |
Slicers Vertical: |
MachineName |
Slicers Horizontal: |
ObjectName, InstanceName, CounterName |
- Under ∑ Values, right-click Sum of CounterValue, and click Edit Measure.
- In the Measure Settings dialog box, under Custom Name, type Average Counter Value. Under Choose how you want the selected field to be aggregated, select Average, and then click OK.
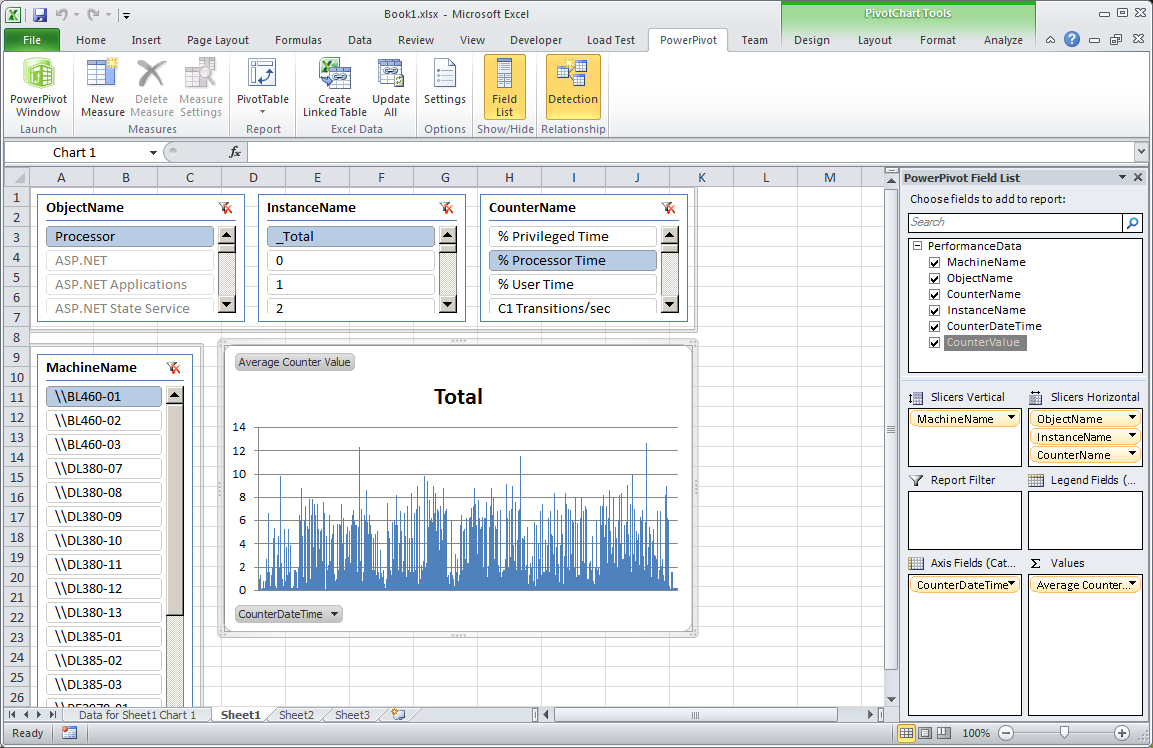
- Test your solution by clicking on the following slicers:
Slicer |
Value |
ObjectName |
Processor |
InstanceName |
_Total |
CounterName |
% Processor Time |
MachineName |
<Any Computer> |
- Format the chart according to your own preferences, such as by deleting the Total legend and the date values from the x axis. Don’t forget to save your work.
Additionally, if you want to analyze performance data based on server roles, you must add a lookup table to the PowerPivot model that associates each server with a role. A linked Excel table is a good choice for this purpose:
Switch to Sheet 2 in Excel. In cell A1 type Machine Name and in cell B1 type Server Role.
In the A and B columns of subsequent rows, type the machine names as they appear in the MachineName slicer and specify a server role, such as WFE, ECS, PP, or DB. Make sure that you list each machine name only once (the lookup table must not contain duplicate machine names).
Select the rows that have values in the A and B columns (make sure you do not select any empty rows), and then on the Home ribbon, click Format as Table.
Select an appropriate table style and then in the Format as Table dialog box, select the checkbox My table has headers, and click OK.
Switch to the PowerPivot ribbon and click on Create Linked Table. Verify that PowerPivot creates the linked table successfully. Rename the new table to ServerRoles.
Switch to the PerformanceData table, right-click the MachineName column, and then select Create Relationship.
In the Create Relationship dialog box, under Related Lookup Table, select ServerRoles, and under Related Lookup Column, select Machine Name. Then click Create.
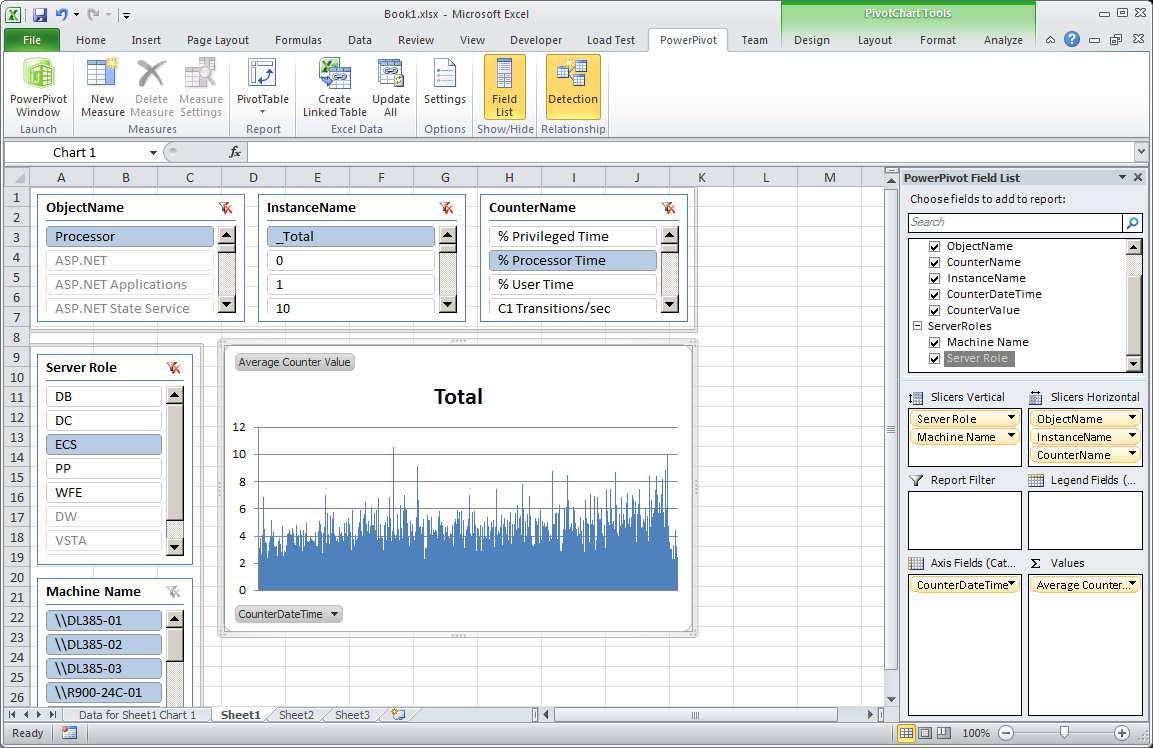
Switch back to Sheet 1 in the Excel window and select the chart with the performance counter values.
In the PowerPivot Field List, notice the message that the PowerPivot data was modified. Click Refresh.
A new ServerRoles node appears in the field list. Expand this node and then drag Server Role to the first position in the Slicers Vertical box, drag the Machine Name node to the second position in the Slicers Vertical box, and then remove the old MachineName slicer by dragging it out of the Slicers Vertical box and dropping it in an empty area.
Note: Due to the direction of the table relationship, the Machine Name column from the ServerRoles table slices both, the ServerRoles table and the PerformanceData table. The MachineName column from the PerformanceData table only slices the PerformanceData table. Therefore, replace the existing MachineName slicer with a new Machine Name slicer to slice the data consistently.
Click on any entry in the Server Role slicer to analyze average performance counter values for groups of servers based on roles.
That’s it for now. Save the workbook and copy it to a document library or other location if you want to share it with others. Note also that you don’t ever need to repeat the modeling work for subsequent performance tests. Just refresh the data in PowerPivot and Excel to load the latest performance counter values from the PerfData database and your job is done! Of course, it might be worth adding some advanced features to this solution by using DAX. This will be the topic of my next blog post. Stay tuned.