Linked Tables
In our previous blog post, we discussed how easy it is to use the Copy/Paste feature of the PowerPivot [aka Gemini] add-in to bring in data from virtually any external source that cannot otherwise be accessed by means of an ODBC, OLEDB or Managed .NET provider. In these scenarios, business users are free to copy new or updated data at any time, but the source of the data is not retained in the model itself, and so multiple copies may need to be manually performed over the model’s life span in order to reflect changes to the sources.
Now consider the following business scenario: an analyst needs to produce a forecast of their company’s sales by product over the next year. Then, he or she must create a report combining the actual and forecasted data, with the forecasts being reviewed and updated at the beginning of each quarter. To do this they will need to thoroughly analyze actual historic data, explore trends, make a number of assumptions, to eventually come up with the forecasted values; some of them might be directly inferred using basic arithmetic formulas; but others could result from far more complex calculations, or need to be keyed in manually.
Excel is the natural tool of choice for such scenarios that blend ad-hoc data analysis, business modeling, data entry, and reporting tasks. Together with the PowerPivot add-in, it allows business analysts to seamlessly mash up, massage, and relate massive amounts of data from multiple heterogeneous, refreshable sources. And thanks to the linked tables feature, regular Excel tables can now be combined with other external data sources to support scenarios where data editing is required.
For example, consider the following table in Excel:
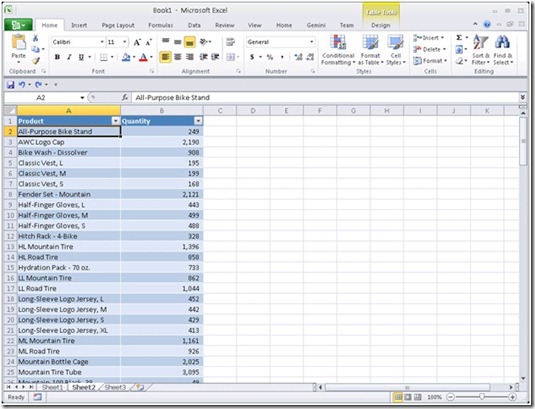
This workbook contains sales data for a number of products; the data was simply keyed in manually in Excel as a regular range, and then made into a table by applying one of the available formats from the Format as Table gallery in the Table Tools ribbon tab. Alternatively, it may have resulted from a query against an external database, or from a bunch of user-defined Excel formulas, or a combination of both.
Making this data available to a PowerPivot model is as simple as going to the Gemini [aka PowerPivot] ribbon tab in Excel, and clicking the Create Linked Table button:
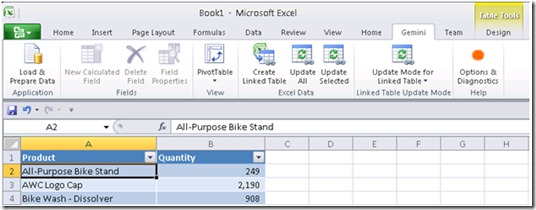
At this point, PowerPivot first analyzes the table’s data, automatically detecting the columns names and data types, and then adds a new table to the model while maintaining a live link to the source table in Excel:
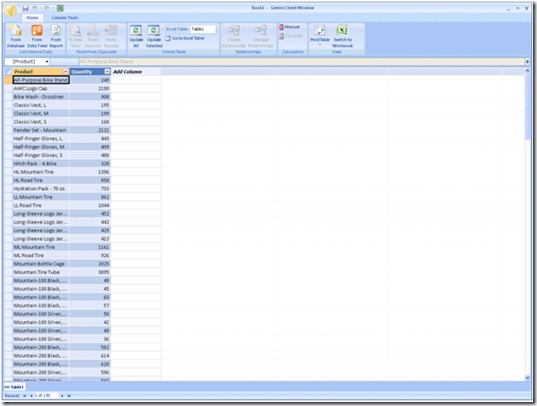
Notice the name of the table in the PowerPivot window: it defaults to the name of the source table in Excel, as it appears too in the Excel Table field of the PowerPivot window Home ribbon tab. Also notice the link icon next to the table name, which lets users quickly identify the linked tables in a model; this is important because linked tables have some unique capabilities and behaviors, which they do not share with other types of PowerPivot tables.
Now to truly appreciate that, let’s switch back to Excel and see what happens when the source table is updated. The shortest and easiest way to go back directly to the right source table in Excel, is to click the Go to Excel Table button in the PowerPivot window ribbon; note that this, as well as the PowerPivot linked table feature in general, will work only in the context of the current Excel workbook, i.e. the workbook that the PowerPivot model is defined in.
Back in Excel, update the contents of the Quantity column by either typing in new values, or by changing the column’s formula – in the latter case, you will probably want to make sure that the new formula gets propagated to all rows, as shown below:
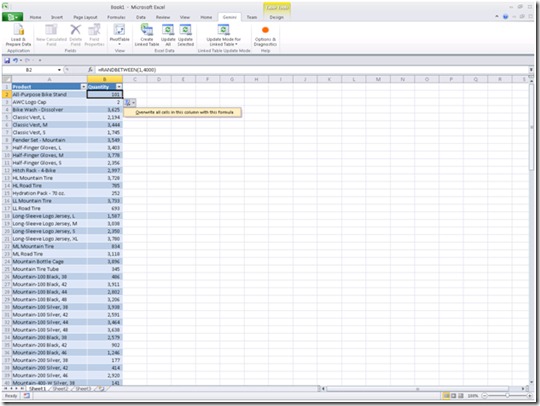
Next, in the Gemini ribbon tab of Excel, locate the Update Mode for Linked Table split button: it defaults to Automatic Update, meaning that data from all Excel tables in this workbook gets automatically propagated to the corresponding linked tables, as soon as the user switches to the PowerPivot window. In manual mode, the refresh behavior is controlled by means of the Update All or Update Selected buttons; also note that these buttons exist in both the Excel and PowerPivot windows:
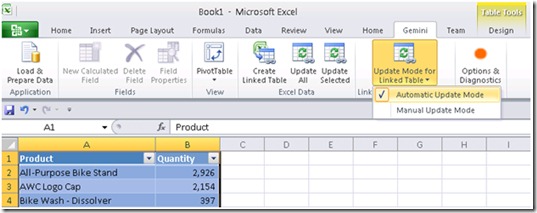
Now, to force an immediate update, simply click on the Update Selected button; this automatically switches back the focus to the PowerPivot window and triggers the refresh:

Notice how the linked table now contains the most recent data from Excel; thanks to this live link between Excel and PowerPivot, business users can conveniently add data to their models, which can then easily be edited and maintained as a whole right from within the familiar, self-contained Excel environment.
Once a linked table has been created in a PowerPivot model, it behaves just like any other table and supports renaming any of the existing columns, adding new columns from the source or by writing DAX formulas, participating in relationships with other tables from the same or a different data source, etc.
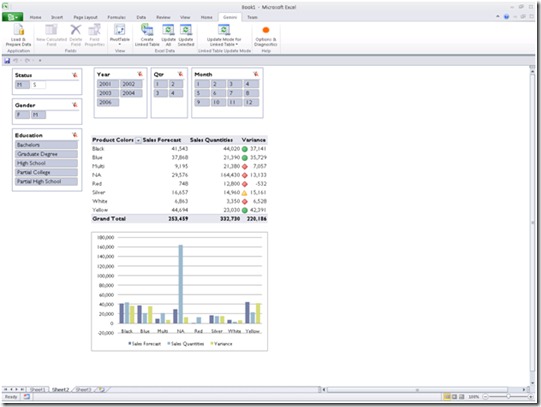
Thanks to linked tables, sophisticated dashboards that mix and match refreshable data from sanctioned, IT-managed sources, and adhoc, volatile data that captures the business knowledge and assumptions of subject matter experts, are easier to build than ever before; for example, the below report combines data from a SQL Server relational database, a flat file, and a linked table:
Simply put, linked tables are regular Excel tables that are surfaced in a PowerPivot model; by leveraging the editing and computing capabilities of Excel in the PowerPivot add-in, business analysts can build richer models that truly bring together the best of both worlds.