Team Foundation Server Reporting and Visio
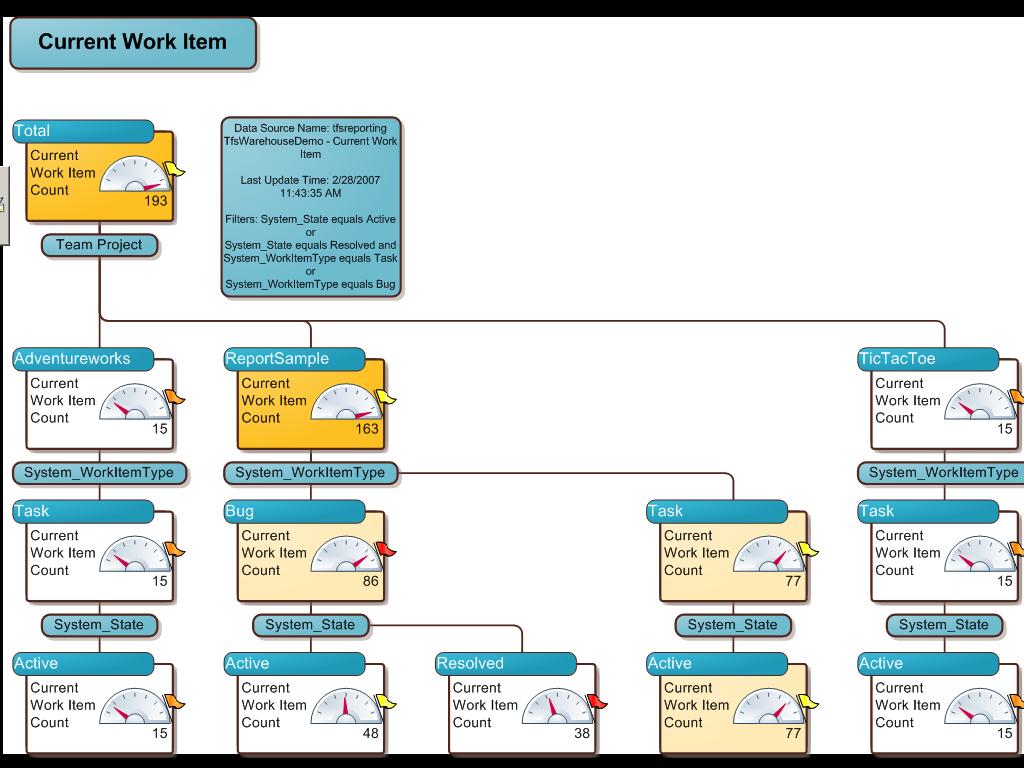
Visio 2007 has some very cool new reporting features. I'm very excited about the the PivotDiagram features in particular. PivotDigrams can be used to slice and dice data just like Pivot Tables in Excel. Here's an example of a Visio report that shows the active and resolved bug and task distribution across a number of projects on a server.
And, here are a couple of videos that walk you through writing these reports.
Video: Building a Team Foundation Server report using Visio 2007 Part 1
Video: Building a Team Foundation Server report using Visio 2007 Part 2
Let me know if these walkthroughs were useful and if you have any other walkthrough ideas I'd love to hear those as well.