Working with NetMon & WireShark Traces
Wireshark can read Netmon trace files.
Hence just before starting the test we started Netmon on all the machines and saved the CAP files generated with names identifying each of the machines
High-level Objective
We have the task to validate the following:
Traffic going out from 10.52.1.106 is always going either to the 10.52.6.5 m/c or the 10.52.6.6 m/c and we should never be seeing any of the traffic to 10.52.1.104, 10.52.1.111 or 10.52.1.110.
However, the purpose of this BLOG is not to get into the details on how we investigated the pattern.
The purpose is to walk through a basic approach on how to read Netmon trace files when the reader himself is not a Network specialist himself.
I show in a few screen captures of the popular Tools like Netmon and Wireshark how you could mine the data you are looking for.
Opening the Netmon trace in WireShark
We have the Netmon trace Files captured during a Test Run. These capture files OR .CAP Files can be opened in WireShark as well. In fact, you could also use LogParser to query the .cap file and get your numbers.
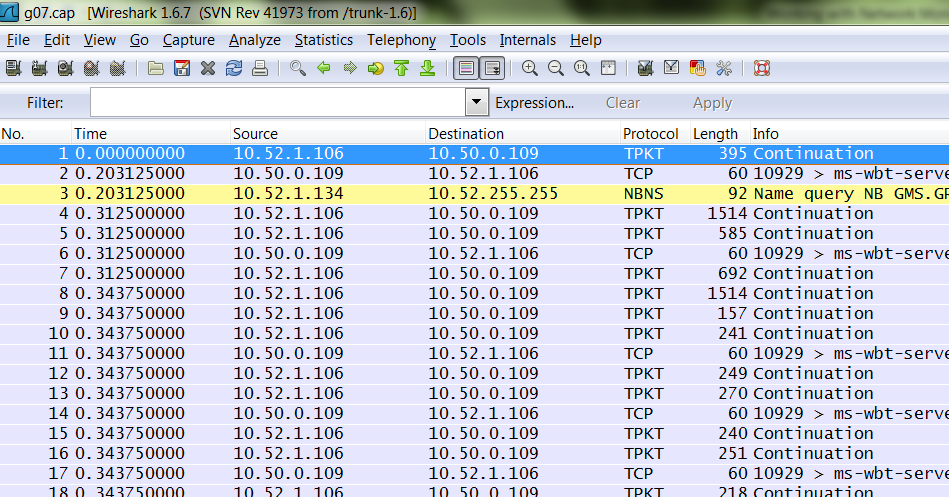
The WireShark Window with the .cap file opened
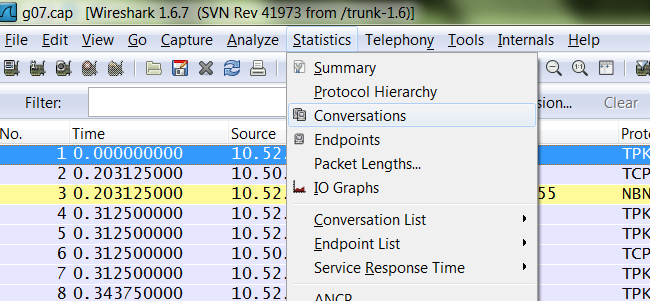
From the “Statistics” drop down menu click “Conversations”
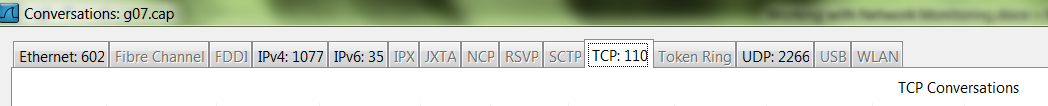
Since we are interested in only the TCP traffic, hence click the TCP Tab
All the column headers in the Display are very much self-explanatory. We were looking for traffic or packets specific to Groove hence that’s the port we needed to filter on
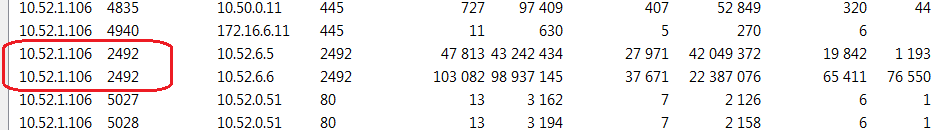
After quickly eye balling, we zeroed into two rows of data that had the outgoing port as 2492 and the IP as 10.52.1.106
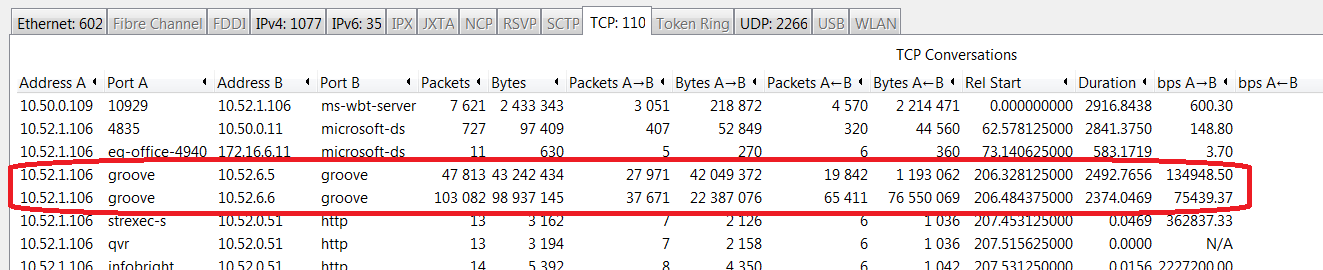
Now we needed to validate, the sum of the outgoing bytes to both the destination IP’s - 10.52.6.5 & 10.52.6.6 was equal OR nearly equal to the total incoming bytes on these two machines.
Hence this view is makes the analysis a lot easier. Infact, you could further click the “Copy” button and paste the content to a EXCEL Spreadsheet and do the rest of your analysis from the spreadsheet.
If you unchecked the “Name Resolution” check Box you would notice the actual groove Port on which is communication is going on
Writing custom Query Filters
Writing Filters in Netmon and WireShark is fairly straightforward
For example:
We want to see all TCP traffic from 10.52.1.106 to 10.52.6.5 which were from TCP port 2492 to the destination TCP Port 2492
ipv4.SourceAddress == 10.52.1.106 and ipv4.DestinationAddress == 10.52.6.5 and tcp.SrcPort == 2492 and tcp.DstPort== 2492
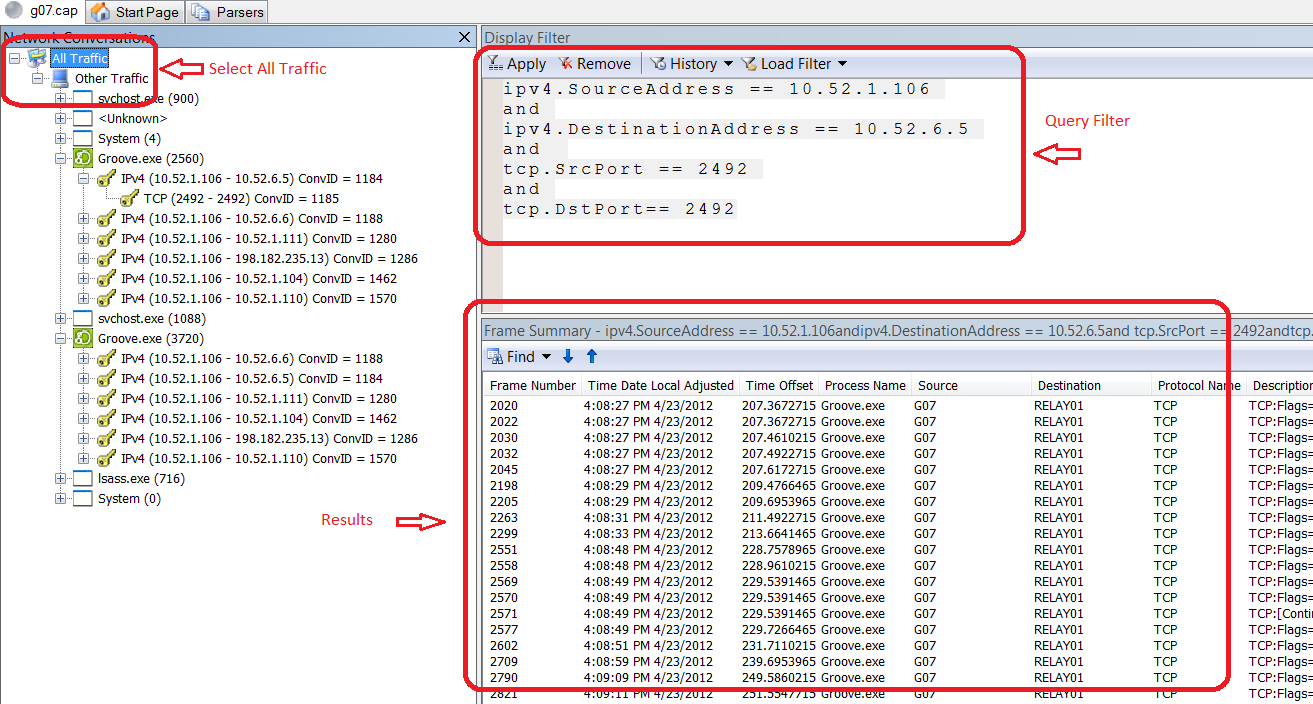
Make sure to select “All Traffic” The match will pop up in the window below
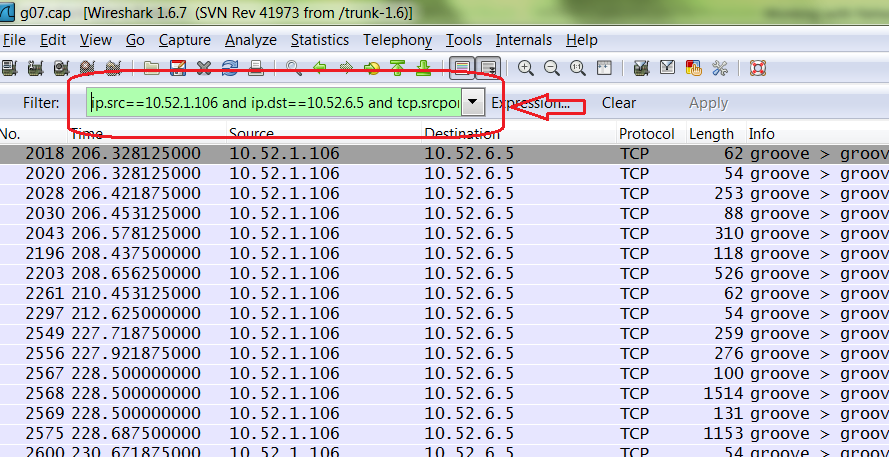
Query to do the similar thing in WireShark would be
ip.src==10.52.1.106 and ip.dst==10.52.6.5 and tcp.srcport eq 2492 and tcp.dstport eq 2492
Logparser
Log parser is a great tool which can come very handy when you are dealing with different Log formats and you need to mine important data out of these Logs. It can read IIS Logs, Event Viewer Logs and also Netmon Capture Logs.
Find more information on Log Parser from here
https://www.microsoft.com/en-us/download/details.aspx?displaylang=en&id=24659
Known issues on Windows 7
If you are trying to parse the Netmon trace File through Logparser, the SrcIP and the DstIP fields might appear to be blank. This is a known issue with Win 7. However parsing should work just fine on a XP or a Win 8 machine.