Collecting a memory dump with ProcDump when ASP.NET ISAPI is reported unhealthy or deadlock detected in an ASP.NET application
PROBLEM
- You are running an ASP.NET application in IIS.
- You noticed that the worker process shuts down and restarts.
- At the same time you see one or both of the following events in the event logs:
Event ID 2262: ISAPI 'C:\Windows\Microsoft.NET\Framework\<version>\aspnet_isapi.dll' reported itself as unhealthy for the following reason: 'Deadlock detected'.
Event ID 5013: A process serving application pool 'app_pool name' exceeded time limits during shut down. The process id was '<PID>'.
ACTION PLAN
Memory dump analysis is required to find out the root cause most of the times. You can follow the steps below to collect memory dumps automatically:
1) Download ProcDump from https://technet.microsoft.com/en-us/sysinternals/dd996900.aspx on your server and extract it.
2) Copy the ProcDump.exe, ProcDump64.exe and Eula.txt files to both C:\Windows\System32 and C:\Windows\SysWOW64 folders.
3) Create C:\Dumps folder where the dump files are written. You can use another local disk or folder but you should change it in the step 5.
4) Open IIS manager, find your application pool which is reported unhealthy and open its advanced settings.
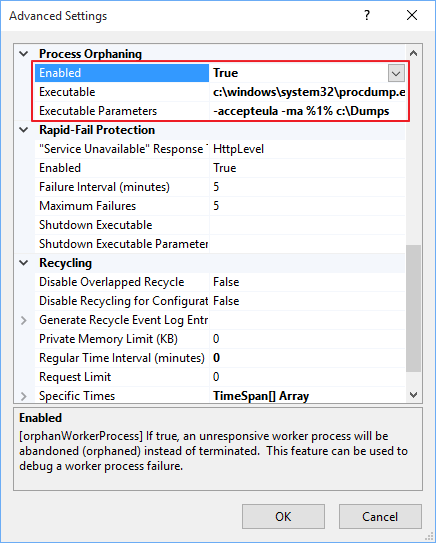
5) Find Process Orphaning settings and configure it as below, as seen in the screenshot:
Enabled: True
Executable: c:\windows\system32\procdump.exe
Executable Parameters (if your application pool is 32bit): -accepteula -ma %1% c:\Dumps
Executable Parameters (if your application pool is 64bit): -accepteula -64 -ma %1% c:\Dumps
6) Click OK to close the dialog box. When the same issue happens the dump(s) should be generated in the c:\Dumps (or where you configured) folder.
NOTES
1) Do not forget to disable Process Orphaning when the dumps are collected.
2) A memory dump is a snapshot of a process memory so the size of a dump file will be approximately the same as the size of the process in the memory. For example, if a process consumes 2 GB of memory when taking the dump, then the dump file will take approximately 2 GB in the disk. Please set a location where you have enough free disk space.
3) Avoid writing dumps to a network share or a slow disk (is there any slow disk left?) because when a dump is being written, all threads of the process will be suspended. Any requests arrive while the dump is written will be queued until the dump file is completed.
TIP FOR ANALYZING THE MEMORY DUMP
The issue described in the PROBLEM section may be mostly related with some requests waiting to acquire a lock which is owned by another thread. If a lock is not relased for enough time, IIS assumes that the process is deadlocked and WAS terminates the worker process, reports it as unhealthy and restarts a new one.
You can open the dump in WinDBG and use SOS extension's SyncBlk command to analyze the locks. Try to find out which thread owns the lock and why it does not release that (e.g.: thread may be doing a long running task in a lock). You can also use Debug Diagnostic's Auto Analyse feature and review the report generated.
MORE INFORMATION
Process Orphaning feature of IIS allows you to avoid terminating the “unhealthy” or “deadlocked” process so the “orphaned” process could live in the memory, without accepting any requests, for troubleshooting purposes (for example attaching a debugger to it or taking the dumps of it).
REFERENCES
Managing, Tuning, and Configuring Application Pools in IIS 7.0
https://technet.microsoft.com/en-us/library/cc745955.aspx
APPLIES TO
All supported IIS versions
All ASP.NET versions