Under the Hood - Performance Considerations of a Garbage Collector
 Welcome to the Alpha Geek blog, where we’re going to cover how software gets made at Microsoft. We’ll share the good and the bad, directly from the engineers that build the tools and frameworks you use. In this first post to the Alpha Geek blog, we’re going to explore the performance considerations and measurements that the Garbage Collection (GC) team has gone through so that you can have a better understanding of how the GC process affects your applications.
GC performance from a high level
In a system with a garbage collector, the GC acts as a service. It provides memory safety and automatically cleans up objects that are no longer referenced. As a service, it comes with a cost – when GC does its work, it takes away resource from the mutator, ie, the user threads. Naturally, the more heavily you use memory, the more you care about the GC performance. It’s very important to understand that some frameworks have a different memory allocation and survival patterns that make GC performance more or less significant than other frameworks. When you implement something in one framework, they might allocate much fewer and more temporary objects. This means much less pressure on their GC than another framework that allocates more and longer lived objects on that framework’s GC.
In this document we are only looking at the performance of a GC, which means we are trying to understand how various kinds of workload perform from GC’s perspective. We are not trying to compare how the allocation and survival patterns differ between different frameworks or different versions of the same framework. Of course even with the same workload, it’s still not an apples to apples comparison as different GCs have different restrictions which can affect the implementation dramatically. For example, the CLR GC needs to handle pinning (since we support pinning as a feature for our framework) which is not the case for some other GCs.
3 performance aspects of a GC
Now we describe the 3 key performance aspects of a GC.
- Throughput. It determines how fast you can handle requests. It plays a major part in the cost model of running an application (eg, how many cores do you need to pay for a VM you rent on Azure or AWS?). When GC is running, it takes CPU away so less time spent in GC means more time can be spent in the application code.
- Memory footprint. How much memory your application requires is another extremely important performance metric people look at. You are paying for the memory you need. Lower memory usage means you can pack more sites on a web server; you can run more instances of your processes on one machine or handle more concurrent requests in your process.
- Pause predictability. Server applications have SLAs to meet. This means customers want the pauses to be predictable. If individual GC pauses are short, generally that means they will have an easier time to cope with these pauses; but if there are long pauses that take up a significant percentage of the total request time, it will cause the application to fail to meet the SLA. So from a practical stand point this means shorter individual pauses are more predictable.
Changing one performance aspect can affect others. For example, if we let GC run less often so we spend less time in GC code, we will increase throughput but the memory footprint will go up. And when we do a GC, that GC might be very long as we’ve accumulated more objects that survive. If we let GC run very often, each individual GC pauses might be very short as we have very few survivors but each request will incur so many GCs that the total GC time add up and the throughput suffers.
If we use a pie chart to represent the total performance of a GC, and 3 slices to represent the 3 aspects of the performance and bigger slices represent better the performance, when we make one aspect’s performance better, it usually means we need to make a tradeoff for another aspect. Of course that’s not always the case. If we optimized the implementation of a mechanism we use in a GC, or we added a new flavor of a GC that lifts some inherent limitations of the current GC, we could make one or more aspects so much more performant that the pie itself becomes bigger.
For example, if we didn’t have concurrent GC implemented (which means whenever a GC happens it needs to stop all managed threads), let’s say we have the same score for all 3 aspects to begin with. By implementing a concurrent sweeping GC (which is a lot more common than concurrent compacting GCs), we improve the pause predictability, but we have more GC work to do which means we sacrifice throughput. And since we don’t compact, we use more memory, and for memory since we consider it worse perf if we use more memory, it means the Memory area will be smaller. So we might see this transformation in the pie chart:
[caption id="attachment_45" align="aligncenter" width="300"]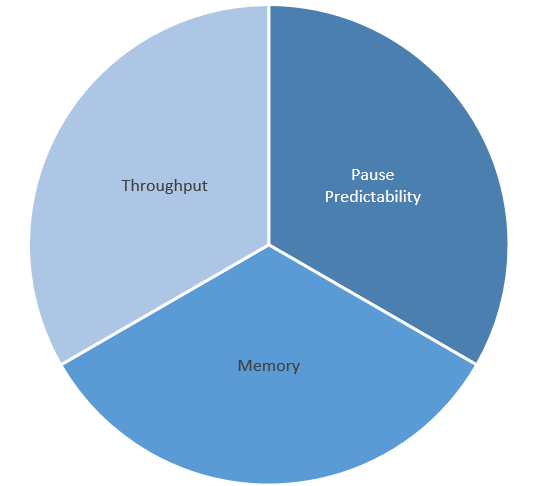 No Concurrent GC[/caption] No Concurrent GC[/caption] |
[caption id="attachment_55" align="aligncenter" width="300"]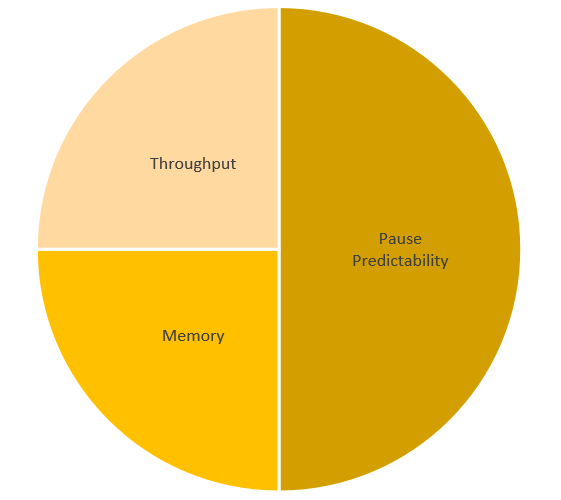 With Concurrent Sweeping GC[/caption] With Concurrent Sweeping GC[/caption] |
Being competitive in the Cloud space
From the GC team’s point of view, naturally we want to be competitive when we compare ourselves to other GCs. Currently the Cloud space is the one we are focusing on as it’s a very demanding area for GC. This means 2 things: A) We want to make sure our GC meets our current customers’ requirements; B) We want to understand how we compare to GCs in other frameworks in this space so we know how we can attract new customers.
CLR has many first party customers that have extremely large and stressful scenarios. We have chosen what to optimize based on their needs. 2 examples from our first party customers:
Bing Search: they’ve been optimizing their % time in GC. They’ve gotten it down to 1% or less.
Exchange: they run many managed processes (on the order of 60 to 70) on each machine – in order to fit all these processes with the number of concurrent requests they handle, both memory footprint and throughput are very important.
Historically, the CLR GC had been concentrating on optimizing for throughput and memory footprint. However, we are considering providing more ways for users to communicate to us what aspect of performance they are trying to optimize for and GC will tune itself accordingly.
Doing performance analysis
There are many dimensions an application can vary its allocation and survival patterns to affect the amount of work a GC has to do. The figure below depicts the most fundamental ones that we use in our performance analysis:
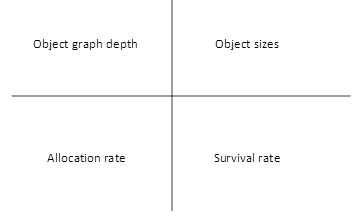
For server applications we also want to observe long term effect as a server application is expected to stay up for a long time. Often when people do performance analysis, they run the test for a few seconds but for GC analysis, this is not enough at all. We must see the long term of a GC. So we run our benchmarks for a long period of time (~10mins) in order to observe whether any of the key performance aspects regress overtime.
Summary
Our GC team is continuing to work on improving the performance of our garbage collector to find the limits of the pause predictability and determine how best to improve that. The design, discussion and work on the .NET Core GC is on GitHub if you are interested in learning more.
Thanks to Maoni Stephens for helping with this article. You can read more from Maoni at: https://blogs.msdn.microsoft.com/maoni/
Did we discuss enough technical depth on this topic? Are there other things about the .NET framework that you would like to learn about? Reply in the comments below and we will gather the engineering experts to explore these topics on future Alpha Geek blog posts.
Truck photo courtesy of bilbobagweed on Flickr