Troubleshooting missing data in Code Coverage Results
Code Coverage tool in Visual Studio 11 instruments native and managed binaries (DLLs/EXEs) whenever they are loaded at runtime, if they meet some criteria. The code coverage information is collected for these binaries
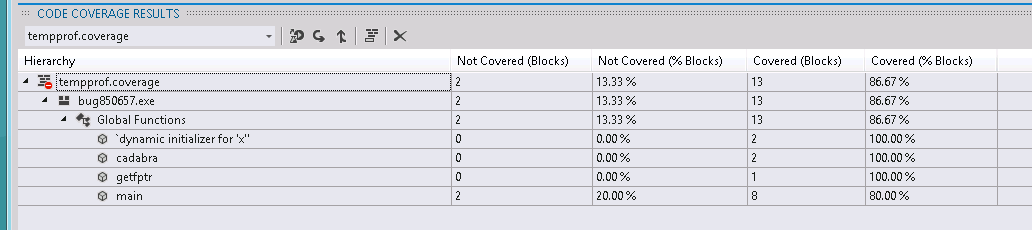
At the end of the Code Coverage run you see code coverage within the Code Coverage results window. The total code coverage as well as code coverage for each binary are reported.
However in some cases you may end up with a .coverage file which shows 0% coverage in the Code Coverage Results window with an error similar to “Empty results generated: No binaries were instrumented …”
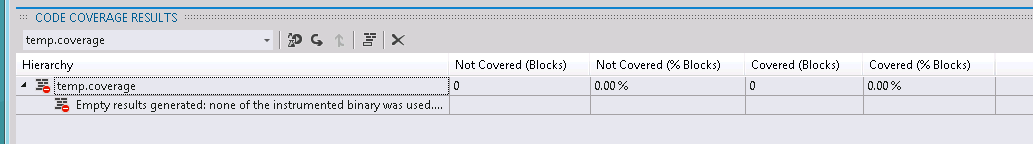
This means code coverage results were not obtained for any binary.
In this article we will attempt to list down the most common reasons for such a problem and provide you with resolutions for the same.
- No tests were executed
- PDBs (symbol files) are unavailable/missing
- Using an instrumented or optimized binary
- Code executed is not managed (.NET) or native (cpp) code
- A custom .runsettings file with exclusions is being used
Reason |
No tests were executed |
Analysis |
Check your output window – Select “Tests” in the “Show Output from:” dropdown to see if there are any warnings or errors logged. |
Explanation |
The Dev11 Code Coverage engine is dynamic in nature. What this means is that the instrumentation of binaries occurs only for those binaries that are loaded into memory. However if none of the tests are executed then there is nothing that is available for the Code Coverage to report. |
Resolution |
Verify if that the tests run fine, without Code Coverage turned on, by clicking on “Run All”. Fix any issues you find here before using “Analyze Code Coverage” |
Reason |
PDBs (symbol files) are unavailable/missing |
Analysis |
Check that all the modules within the solution have their associated PDBs available alongside the binary |
Explanation |
The Dev11 Code Coverage engine requires that every module have its associated PDB available and accessible during execution. If the PDBs are unavailable we will skip the module and not provide any data for the same. Note: PDBs have a direct association with a DLL via build. The DLLs and PDBs should be from the same build for it to be recognized as a valid PDB.
If PDB are not installed alongside the binary, but are present in some share, configure code coverage settings specifying the path to pick the the PDB from. See “Customizing Code Coverage in Visual Studio 11” |
Resolution |
Install the PDB alongside the binary; Or customize code coverage settings by specifying the path to pick the PDB from. |
Reason |
Using an instrumented or optimized binary |
Analysis |
Check if the binary has undergone any form of advanced optimization (like the BBT optimization, Profile Guided Optimization, etc.) or has been instrumented by a profiling tool like vsinstr.exe. |
Explanation |
If a binary has already been instrumented or optimized by another profiling tool eg. vsinstr.exe we skip the binary and do not include it as a part of the coverage results.
Code coverage cannot be obtained for such binaries.
|
Resolution |
Use the non-instrumented / non-optimized version of the binary.
In fact, it is recommended to turn off all optimizations, and run code coverage with non-optimized CHK build to get best results. |
Reason |
Code executed is not managed (.NET) or native (cpp) code |
Analysis |
Verify if your project has any .net or cpp UTs being run |
Explanation |
Code Coverage in Visual Studio 11 is available only for .net and native (C++) code. If you are working with any language that does not fall into either of these categories Code Coverage will not be available for code in these unsupported languages.
This can typically happen if you are developing tests with a third party unit test adapter extension. |
Resolution |
None available |
Reason |
A custom .runsettings file with exclusions is being used |
Analysis |
Verify if you are using a .runsettings file and have specified any exclusion rules that leave out your dlls from being instrumented |
Explanation |
You can run your UTs with a custom .runsettings file with Code Coverage configuration specified in the DataCollectors node. In the Code Coverage configuration we allow exclusions of dlls based on name, company name, public key token etc.You might have, by mistake, excluded all your DLLs, or missed including any of your DLLs here |
Resolution |
Fix your .runsettings to have the minimal set of exclusions that do not exclude your DLLs OR explicitly include the DLLs you want coverage for. |
Further Analysis
To know why a specific DLL was not included by code coverage, you can analyze the .coverage file generated further using our command line utility, CodeCoverage.exe
Cd “<VSInstallDir>\Team Tools\Dynamic Code Coverage Tools”
CodeCoverage.exe analyze /include_skipped_modules my.coverage > analysis.xml
my.coverage is the .coverage file generated for your test run found in the TestResults folder.
Here /include_skipped_modules will provide information regarding each and every module that was inspected by the Code Coverage engine and provide a reason why it was skipped. These reason codes are to be interpreted as below:
Reason |
Resolution |
no_symbols |
|
public_key_token_is_excluded path_is_excluded company_name_is_excluded |
See A custom .runsettings file with exclusions
|
optimized_or_instrumented |
|
nothing_instrumented |
No code in the dll could be instrumented. See Code executed is not managed (.NET) or native (cpp) code |
instrumentation_failure |
The engine itself failed due to some internal error. Please try again. |
If the output file is empty, see “No tests were executed”