ASP.NET Performance: Web Application Gets Slow Periodically – “Sudden” Traffic Spikes
A customer complained that his web application gets slow each morning at specific times. The rest of the day the application was providing satisfactory performance in terms of response time.
The assumption was that at that times all employees sign in creating unexpectedly high traffic which caused the slow response
We needed to verify it. We needed to build simple histogram that would show the distribution of hits throughout the day. This is what we have done to achieve this.
Prepare IIS logs using Log Parser
Using Log Parser we prepared IIS logs. By “prepared” I mean we consolidated multiple logs into single one. We also removed unnecessary fields making the resulting file smaller. In fact, we needed only time field. Here is the sample LogParser query that retrieves only time for each entry in the log and stores it in Time.log file. Here I assume that all the log files are named ex<something>.log:
LogParser –i :IISW3C "SELECT time FROM ex*.log" -q >Time.log
Analyze IIS logs using Excel
While it is possible to write a more complex grouping query including creating graphs using LogParser but I just think Excel is perfect tool to create graphs, eh? This is what we have done:
Opened the Time.log file inside Excel.
Created another column with the formula similar to this: =CONCATENATE(TEXT(A2,"hh"),":00"

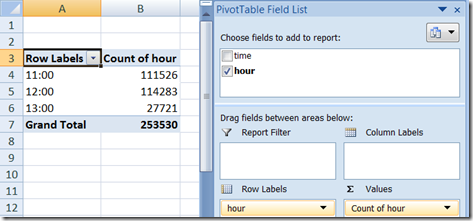
Inserted a pivot table like that:


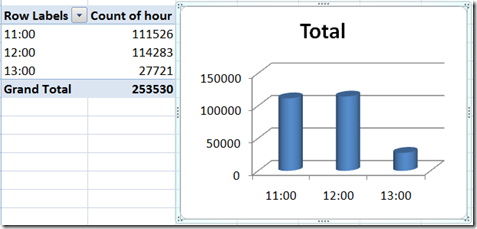
Inserted graph like that

Like it? See when most hits happened? Does it match when the customers complain that the system slow? Now you are able to explain this to your manager or customer too.
LogParser Only Shortcut
Sorry I made you read thus far. Can’t help – love Excel pivot functionality ;)
You could use this simple LogParser query to get same results without Excel:
LogParser –i :IISW3C "SELECT count(*) as hits, TO_STRING (time,'hh') as hour FROM ex*.log group by hour"
The result would look similar to this:
hits hour
------ ----
111527 11
114283 12
27721 13
Related Book
My related posts
- ASP.NET Performance: Web Application Gets Slow Periodically – IIS Recycles
- ASP.NET Performance Engineering - Stress Test Your Architecture, Design, And Code
- Architects UG: 16 Case Studies of ASP.NET Web Performance
- Free Web Performance Tools From Microsoft, Google, Yahoo, And IBM
- Why My ASP.NET Application's Performance Is Less Than Optimal?