Use Performance Counters Templates To Streamline Performance Analysis
I create perf counters sets up front. That way I could start collecting and measuring proper metrics right away each time I am assigned to do detailed performance analysis.
Measuring .NET Application Performance lists important perf counters. What I really love about it is that the guide holds the list of performance counters to collect, explanation for each why collecting it, and the thresholds.
Here are the steps I take creating performance counters templates:
- Open perfmon MMC (start-> run -> perfmon -> Enter)
- Expand "Performance Logs and Alerts" node
- Right click on "Counter Logs" node and click "New Log Settings", provide some name for the new log and hit Enter.
- Add counters to measure - right from Measuring .NET Application Performance.
This is how it may look:
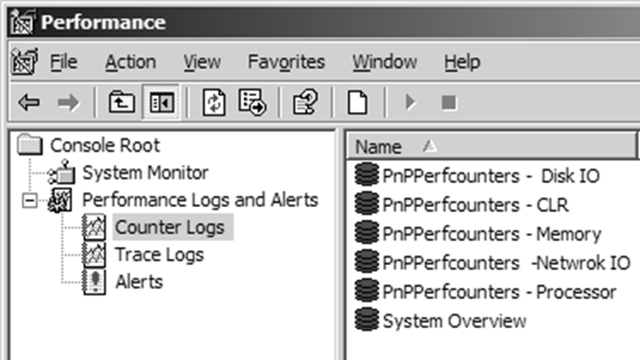 Next would be saving the performance sets I created as depicted. It is done easy by right clicking each and saving it as html page. The resulting html page displays ActiveX with the performance counters in the set.
To restore the performance counters-set to measure it on another computer right click on "Counter Logs" and chose "New Log Settings From..." and point to your html file.
One pitfall though. If the performance counters settings were created for specific computer then it will fail when recreating it on another. To fix it open html setting file in Notepad, remove \\MyComputer and save the file. For example:
Before
<PARAM NAME="Counter00005.Path" VALUE="\\MyComputer\System\Context Switches/sec"/>
After
<PARAM NAME="Counter00005.Path" VALUE="\System\Context Switches/sec"/>
That means that performance counters are valid for current computer.
Enjoy