Data Binding Microsoft Chart Control
Overview
When you add a new visualization in your application, the very first thing you do, is bind it to the data. Microsoft Chart control allows many different ways of populating data in the chart and it is important to understand the differences between them and being able to choose the best approach. I put together all the possible data binding options and the scenarios when they should be used.
Data Sources
Before jumping into the binding methods I want to quickly list all the supportable data sources which can be used in chart binding methods. Keep in mind that not all methods accept all source types.
- SqlCommand
- OleDbCommand
- SqlDataAdapter
- OleDbDataAdapter
- DataView
- DataSet
- DataReader
- List
- Array
- IList
- IListSource
- IEnumerable
Data Point X and Y values
When you bind chart you create series and series data points. Each data point in the series should have it's Y value set and in addition to the Y value you can also bind or set other data point properties:
- X Value - Defines location of the data point along X axis. If not specified, data point index in the series will be used.
- Additional Y Values - Chart types like Bubble or Stock require multiple Y values. You can also bind additional Y values in the regular chart types, if you want to use those values for labels or tooltips.
- Category - When you displaying categories on the X axis, they are stored in the AxisLabel property of the data point. All data binding methods will automatically detect the type of the data and you should not worry about it.
- Other Properties - Some of the binding methods allow you to set additional properties like data point labels, tooltips and others.
Binding Options Overview
This table lists data binding techniques, starting from the most basic methods proceeding to more advanced.
Chart.DataBindTable |
|
|
Chart.DataSource and Chart.DataBind |
|
|
Points.DataBind(X)Y |
|
|
Points.DataBind |
|
|
Chart.DataBindCrossTab |
|
|
Binding Options Details
Chart.DataBindTable method
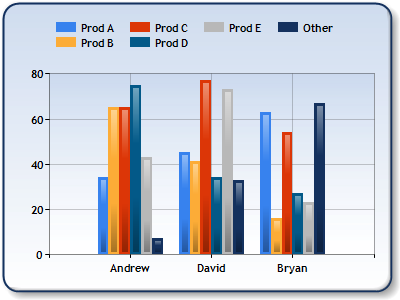
The Chart.DataBindTable method is the simplest way to bind chart to a table with several columns. New series will be automatically created for each of the columns and you can optionally use one column for the X value for all series.
Example
Imagine you have a data source containing these columns: Prod A, Prod B, Prod C, Prod D, Prod E, Other and SalesName, you can easily create chart below with a single line of code:
Chart1.DataBindTable(myReader, "SalesName");
Chart.DataSource property
Chart DataSource property is the only way to bind chart at design-time. In addition to specifying the DataSource property you also need to create series and set their YValueMembers and optionally XValueMember properties. Multiple Y values can be bound if you specify comma separated list of members in the YValueMembers property.
Chart will automatically bind itself to specified data source and members just before rendering. You can force chart to bind at any moment by calling Chart.DataBind() method.
// Set chart data source chart1.DataSource = myCommand; // Set series members names for the X and Y values chart1.Series["Series 1"].XValueMember = "Name"; chart1.Series["Series 1"].YValueMembers = "Sales"; // Data bind to the selected data source chart1.DataBind();
DataBindCrossTab
The Chart.DataBindCrossTab is different compared to all other binding methods, in that it allows for the grouping of unique values in a column. Each unique value in the specified grouped column results in the creation of a data series. In addition, extended data point properties other than X and Y values can be bound.
These other properties are bound using the otherFields parameter using this syntax:
PointProperty=Field[{Format}] [,PointProperty= Field[{Format}]].A list of these properties are as follows: AxisLabel, Tooltip, Label, LegendText, LegendTooltip and CustomPropertyName (the name of a custom property). For more information on possible formats see the Formatting Types topic in the MSDN library.
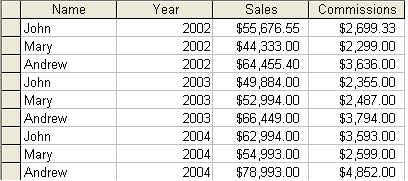
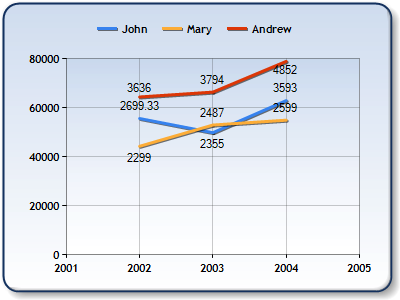
Example
In the sample below we have a table that has the sales and commissions of sales people for three years. We group by the "Name" column, thereby creating one data series per sales person. The X values are bound to the "Year" column, the Y values are bound to the "Sales" column, the Label property of the resulting data points (one per record) is bound to the "Commissions" column, and the LegendText property is bound to the "Name" column.
// Group by "Name" column, bind X values to "Year", Y values to "Sales", // and Label property to "Commissions. chart1.DataBindCrossTab(myReader, "Name", "Year", "Sales", "Label=Commissions");
Points.DataBind
This method allows for data point properties other than X and Y values to be bound to data columns. For example, you want to set data point label to a value in one of the data source columns. These other properties are bound using the otherFields parameter using this syntax:
PointProperty=FieldName[{Format}][,PointProperty= FieldName[{Format}]]A list of these properties includes: AxisLabel, Tooltip, Label, LegendText, LegendTooltip and CustomPropertyName (the name of a custom property).
This method does not allow you to specify separate data sources for the X and Y values of a series (for this functionality use the DataBind(X)Y methods described in the section above).
Example
Code below demonstrates how to bind X and Y values of the series to columns "Name" and "Sales" respectively. The Label and Tooltip properties of the resulting data points are also bound to the "Commissions" and "Year" column.
Chart1.Series["Series1"].Points.DataBind( myReader, "Name", "Sales", "Tooltip=Year, Label=Commissions{C2}");
Points.DataBind[X]Y
The DataBindXY method allows for the binding of X and Y values of a series, while DataBindY binds Y values only. When binding X and Y values using DataBindXY the same or different data sources may be used.
Some data sources support multiple values (e.g. data sources that have columns of data). For example, OleDbDataReader may have access to more than one column of data. If the column to be used is not specified, then the first available column will be used. To use a column other than the first one just specify the column name in the method call.
Note that when specifying the column names to be bound to the Y values a comma can be embedded as part of a column name by specifying a double comma.
Example
Code below demonstrates how to bind series points to the array of doubles.
// Initialize an array of doubles. double [] array = { 2.8, 4.4, 6.5, 8.3, 3.6, 5.6, 7.3, 9.2, 1.0}; // Bind the double array to the Y axis points of the data series. Chart1.Series["Series1"].Points.DataBindY(array);
'Manual' series population
In case you need to perform some custom actions while binding and none of the above methods works, you can always 'manually' bind chart by iterating through the data source and add data points to the series as needed. This approach is also very useful when series data is calculated using some formula.
Example
// Resolve the address to the Access database string fileNameString = this.MapPath("."); fileNameString += "..\\..\\..\\data\\chartdata.mdb"; // Initialize a connection string string myConnectionString = "PROVIDER=Microsoft.Jet.OLEDB.4.0;Data Source=" + fileNameString; // Define the database query string mySelectQuery="SELECT * FROM SALESCOUNTS;"; // Create a database connection object using the connection string OleDbConnection myConnection = new OleDbConnection(myConnectionString); // Create a database command on the connection using query OleDbCommand myCommand = new OleDbCommand(mySelectQuery, myConnection); // Open the connection myCommand.Connection.Open(); // Initializes a new instance of the OleDbDataAdapter class OleDbDataAdapter myDataAdapter = new OleDbDataAdapter(); myDataAdapter.SelectCommand = myCommand; // Initializes a new instance of the DataSet class DataSet myDataSet = new DataSet(); // Adds rows in the DataSet myDataAdapter.Fill(myDataSet, "Query"); foreach(DataRow row in myDataSet.Tables["Query"].Rows) { // For each Row add a new series string seriesName = row["SalesRep"].ToString(); Chart1.Series.Add(seriesName); Chart1.Series[seriesName].ChartType = SeriesChartType.Line; Chart1.Series[seriesName].BorderWidth = 2; for(int colIndex = 1; colIndex < myDataSet.Tables["Query"].Columns.Count; colIndex++) { // For each column (column 1 and onward) add the value as a point string columnName = myDataSet.Tables["Query"].Columns[colIndex].ColumnName; int YVal = (int) row[columnName]; Chart1.Series[seriesName].Points.AddXY(columnName, YVal); } } DataGrid.DataSource = myDataSet; DataGrid.DataBind(); // Closes the connection to the data source. This is the preferred // method of closing any open connection. myCommand.Connection.Close();
Other useful things to know
Here are couple things that you should know about when binding chart:
- Empty Points - Understand what empty points are and how you can use them. Right now the best source of the information is Chart Sample Environment but I will blog about it later.
- AlignDataPointsByAxisLabel - If you are using a stacked chart type with categorical X axis this helper method can be very useful. Find more information in the documentation and Chart Sample Environment.