Application Map - topology of your application in AppInsights
If you've been one of 10% of customers who have this experience enabled (very soon this will be expanded to all customers) you might have noticed this new Application Map page. You can actually force yourself into this experience by using the following URL:
https://portal.azure.com/?appInsightsExtension_OverrideSettings=applicationmap:true
(if you notice that query string parameter disappears after you login, you might need to append it again and refresh the page).
To get to Application Map page, click this item in the settings list - and you will see it in all its glory!
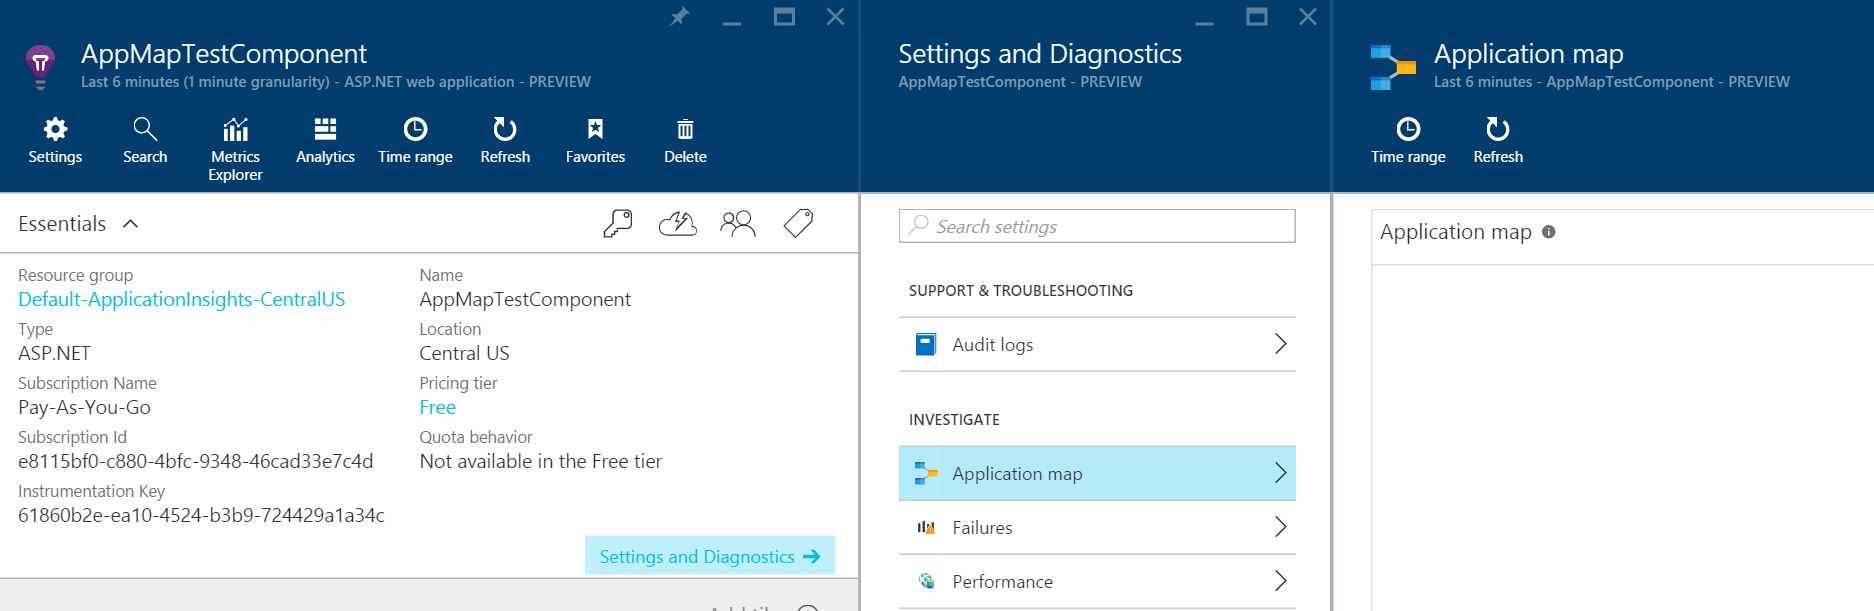
This is how Application Map looks for my website -
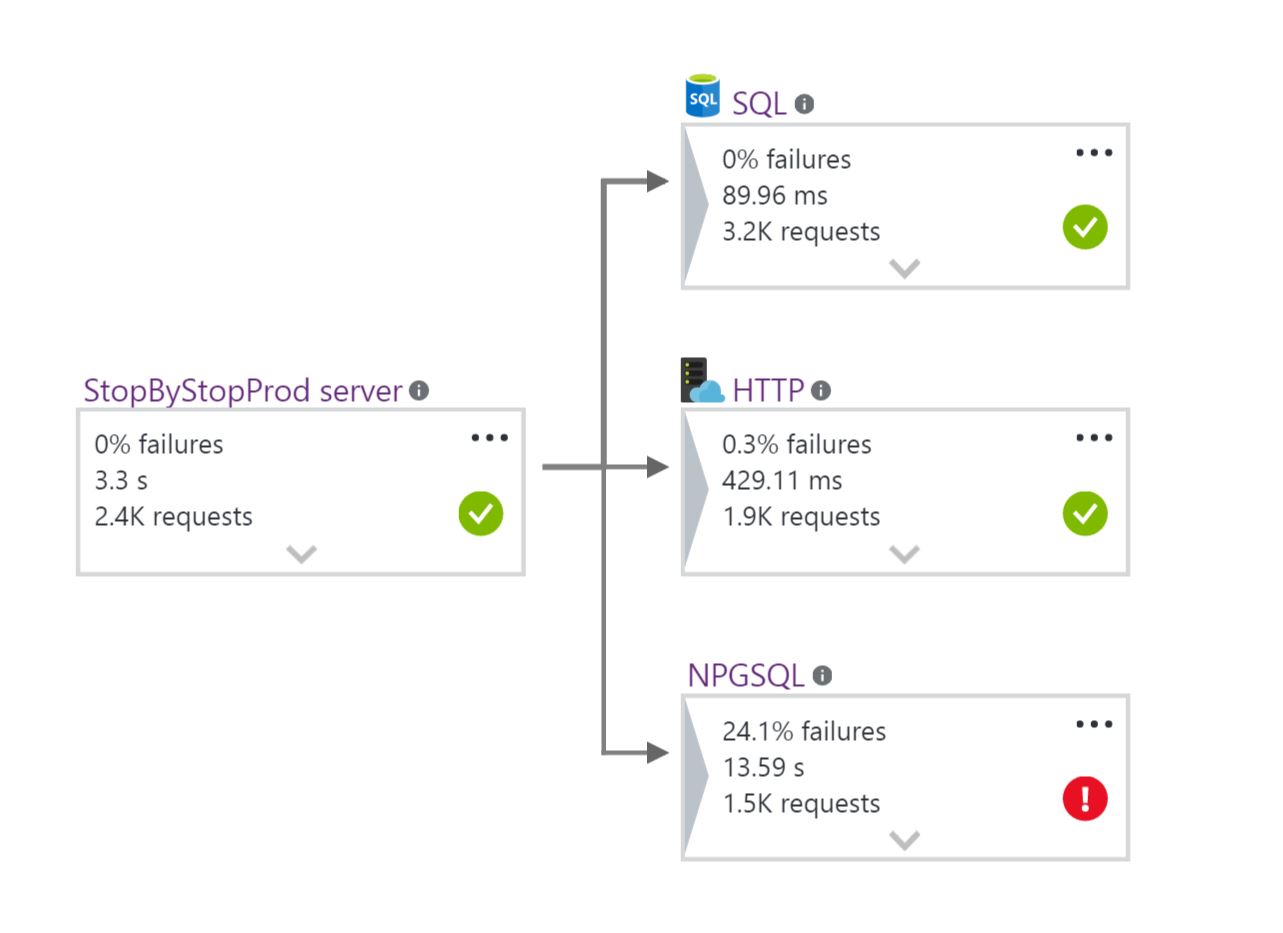
What we are showing on the Application Map is what you application depends on - other components and services that it is making calls to.
For each of the dependency types it is showing average duration and health stats. For example you can see that my application is making HTTP calls, SQL calls and NPGSQL calls (this is a custom dependency that I am logging manually by using TrackDependency() API). If you would like to learn more about dependencies in Application Insights, this is a great place to start:
For a new unconfigured application, Application Map looks like this.
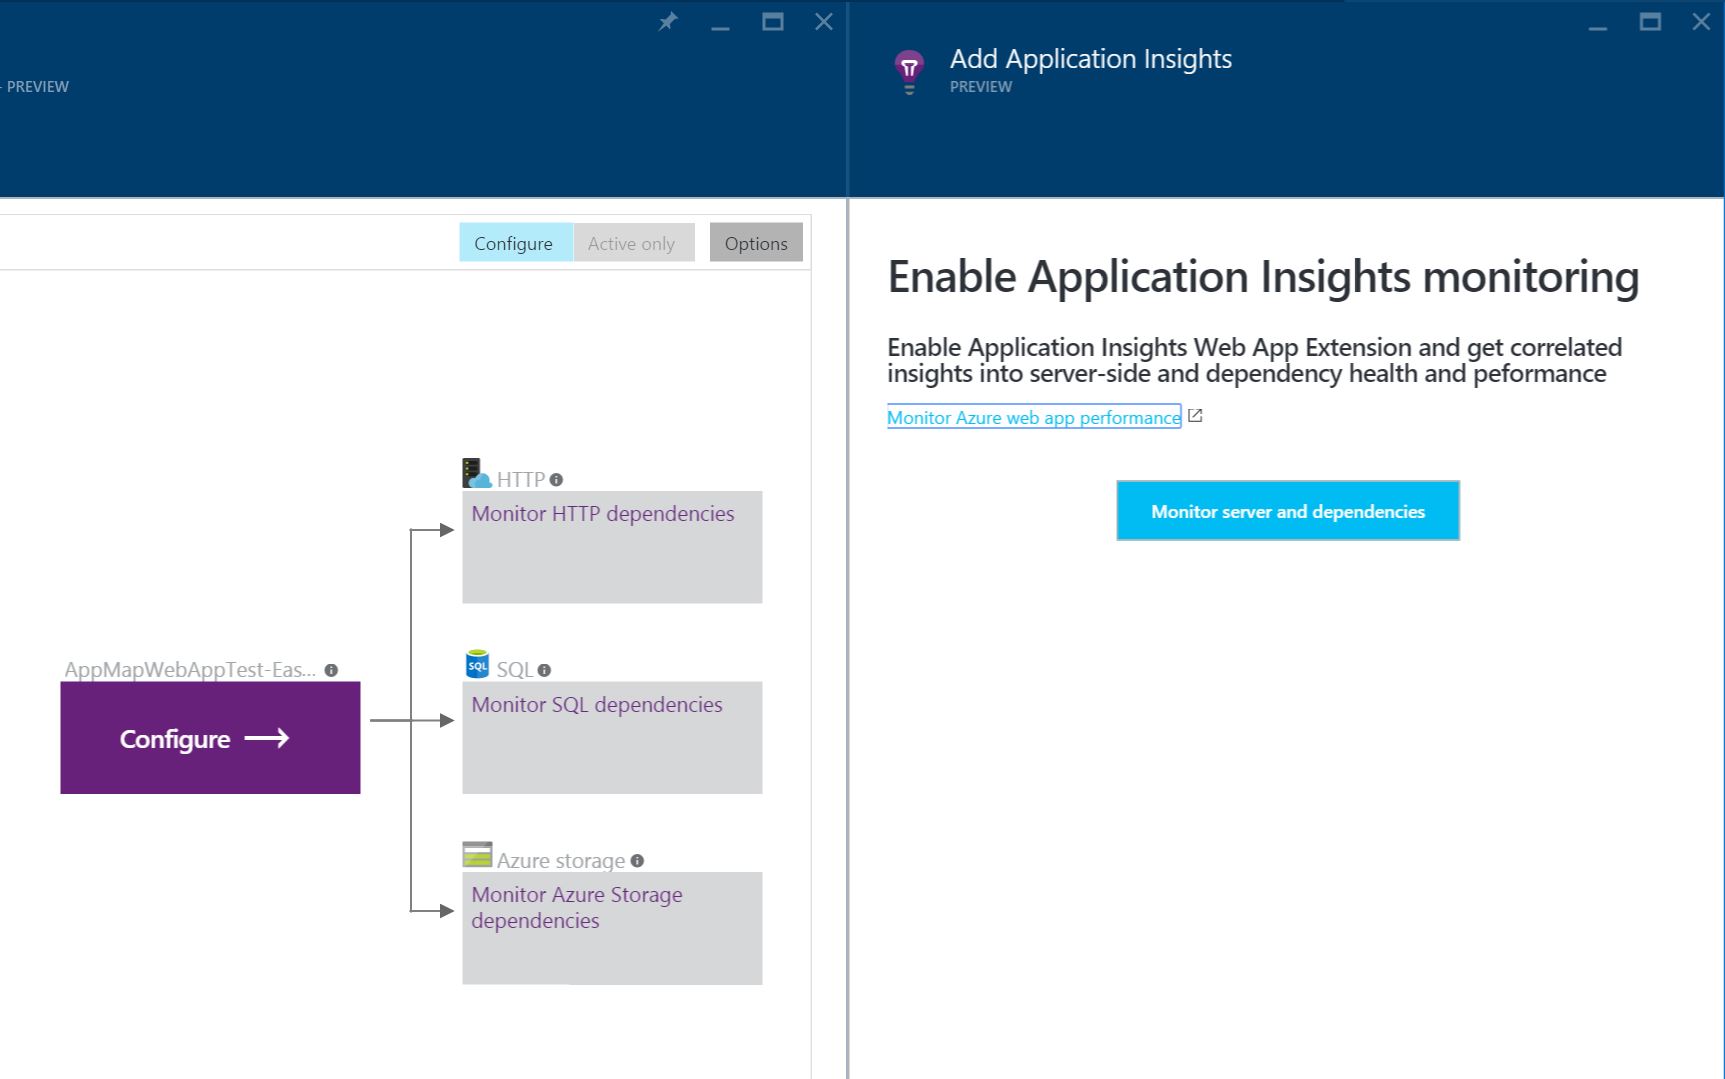
If we detect that your Application Insights resource is linked to a Web App in Azure portal (typical scenario for this is when Application Insights resource was auto-created when created a website), we allow you to enable Application Insights for your web application automatically - just click on "Monitor server and dependencies" button. This is the equivalent to enabling it by adding Application Insights extension from WebApp blade, but, as we a hoping, more discoverable.
What I described was the very first iteration of Application Map experience - we'll continue making updates to it every week. Looking forward to your feedback!