Create a Response Time Graph
Spending my last 4 years helping Microsoft’s enterprise customers improve their line of business application performance, I have interacted with many project managers, business analysts as well as executive officers. Given the non-technical nature of their roles, the first thing that comes into their mind on the subject of application performance is, “How does my application perform under a certain workload?”
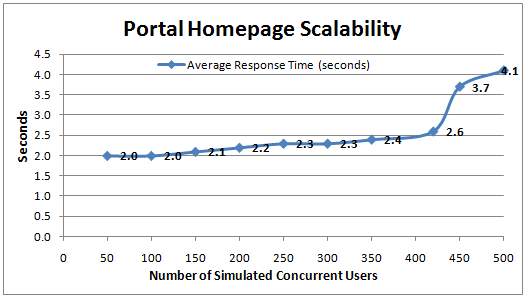
The old saying “A Picture Is Worth A Thousand Words” can certainly be seen on a Response Time Graph. Below you will find a real-world sample I recently put together for a customer while working on their company portal. There are 2 things that are worthwhile to highlight here:
- Somewhere between 420 to 450 concurrent users, the average homepage response time exceeded 3 seconds which is the company’s defined performance SLA upper limit.
- Using data available from the graph, the homepage response times between 50 to 500 concurrent users are predictable. This answered the project manager’s inquiry on “how does my application perform under X users”.
To create a meaningful Response Time Graph, it does not require the purchase of expensive tools or running a dozen application load tests. At a minimum you will need:
- Visual Studio 2008 Team Test Edition or Team Suite (90-day trial available for download here)
- Log Parser 2.2 (free download available here)
- IIS (Internet Information Services) Log
- Office Excel
The step-by-step instructions provided below do not cover the basics of using Visual Studio testing features such as creating a web test. For more information, please look at a list of comprehensive resources on the web available off Ed Glas's blog. Also consider this 7-minute web test step-by-step primer by A.C.E. Performance Engineer Chris Lundquist.
1) Enable the time-taken field in your target application’s Internet Information Services (IIS) log under IIS Manager. Leave the default log format of W3C.
2) Create a new folder under the IIS Log directory (e.g., Test01) and assign it to store the log files.
3) Execute your load test with the Step Load Pattern. As illustrated in the table below, the test begins with 10 users, incrementing by 10 users every 20 seconds until 500 concurrent users are loaded.
Load Pattern |
Step |
Initial User Count |
10 |
Maximum User Count |
500 |
Step Duration (seconds) |
20 |
Step Ramp Time (seconds) |
0 |
Step User Count |
10 |
4) Execute the test and record the start and end time (also available in the Load Test Summary report).
5) Copy the IIS logs to a client workstation with LogParser and Excel installed.
6) Open Excel and create a new spreadsheet with 3 columns: timestamp (A), # of concurrent users (B) and response time (C).
7) Populate column A and B with information you already know either manually or using an Excel formula. For example based on the load pattern defined above I know ~100 users were simulated on the system after approximately 3 minutes into the test. Alternatively, extract data directly from the graphs (User Load) in Visual Studio.
8) Calculate the average response time of your test scenario (e.g. an ASPX page or a web service call) using LogParser:
logparser "SELECT TO_LOCALTIME(QUANTIZE(TO_TIMESTAMP(date, time),60)), Avg(time-taken) AS AvgTime INTO C:\MyTemp\Homepage.csv from C:\Users\eddiel\Desktop\LogIn\ex*.log where (To_Lowercase(cs-uri-stem) like '%/s/app/default.aspx%') and sc-status = 200 and cs-method like 'GET' GROUP BY TO_LOCALTIME(QUANTIZE(TO_TIMESTAMP(date, time),60))" -i:IISW3C -o:CSV
The sample query above is used to calculate the average response time on GET requests to “/s/app/default.aspx” resulted in HTTP status 200, based on 60 seconds increment (quantize function). In other words, I know precisely the average execution time of the portal’s homepage by the minute as user load increases.
9) Populate column C (response time) in the spreadsheet created earlier by matching the timestamp. It is fine when there are more LogParser output rows than what you have defined for column A.
10) Create your Response Time Graph (Scatter with Smooth Line type) in Excel. Add X and Y axis labels accordingly.
Completing step 1 to step 10 should take less than 30 minutes. The result is a meaningful Response Time Graph that is illustrating your application performance—a picture that’s worth a thousand words! I invite your questions and comments. By Eddie Lau.