Live Query Statistics
By Mike Reed – Data Platform Solution Architect.
So you work in an organisation who run 'mission critical' applications but don't want to pay for tooling. You know, they want you to keep the lights on but won't invest in any of the great 3rd party monitoring tools that Microsoft's partners have written to make your life easier. So, you do your best, you write your own suite of monitoring and alerting tools. Sometimes these are pretty sophisticated and if you have the time to invest in them they can be really powerful. Or, you may be at the other end and you just have your 'Top 5 worst performing queries' script that you run when things are going south.
Either way you are going to love some of the new features in SQL Server 2016 that have been put in place to help those monitoring and maintaining SQL Server instances. Actually, these are great features for developers too that will help you tune your queries (you do that right?).
One of those new features is Live Query Statistics, a really nice little feature to help you see what's going on while a query is running. It gives you a view of the query you are tracking whilst its running.
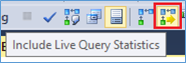
You can turn it on several different ways. The easiest is to hit its icon in Management Studio which sits next to Include Actual Execution Plan:
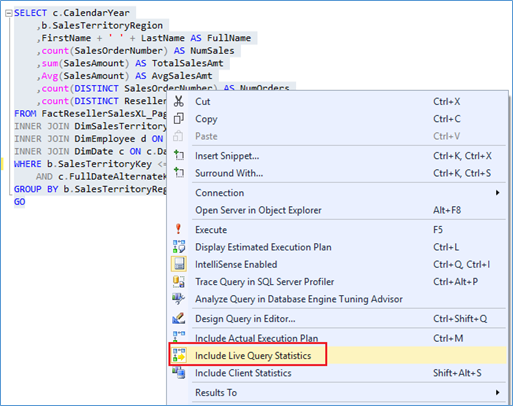
But you can also right click inside the text of a query
And you get a new tab alongside Results and Messages with your Live Query Statistics information in like the screenshot below. How cool is that!
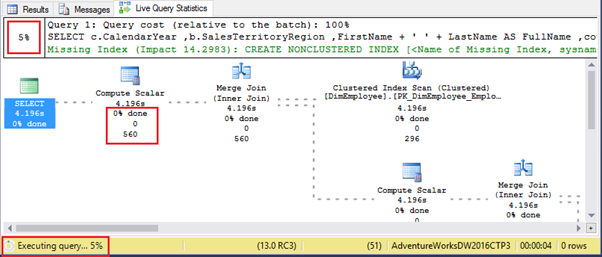
So you get a running progress of the query both in the top and bottom left. Its useful in both places because if you switch to the Results or Messages pane you can still see how far through you are in the bottom left. However, even better, each step in the execution plan has its own little percentage counter so you can see in real time where the hold-up or the pain is.
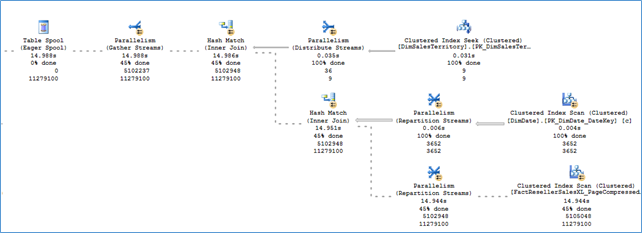
For example, in the Screenshot below you can see that the hold-up is in the bottom right in the read of the FactResellerSalesXL table.
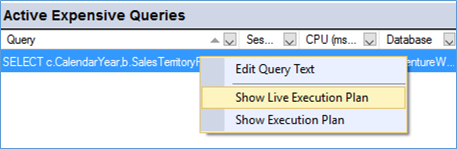
It's also worth noting here that the tool is also available via Activity Monitor. If you right click on a query in the Active Expensive Queries pane you can also activate Live Query Statistics by clicking on Show Live Execution Plan and it will open up in its own tab.
Just a final note that there is a warning on the MSDN page which reminds the user that this feature is primarily supposed to be for troubleshooting and that by using this feature it can 'moderately slow the overall query performance'. You have been warned!!
Hope you enjoy this new feature and it makes your life a little easier.