Monitoring Python Applications with Azure App Insights
Overview
In this blog, I will show how you can use Application Insights to monitor your web application written in Python using the Flask framework. The sample code can be found here. To follow along, you should have access to an Azure subscription. Also your machine should have the following:
- Git client
- Code editor such as Visual Studio Code
- Python 2.7
Setting-up Application Insights
- Login to Azure Portal then click on Create a resource
- Click on Development tools, then select Application Insights
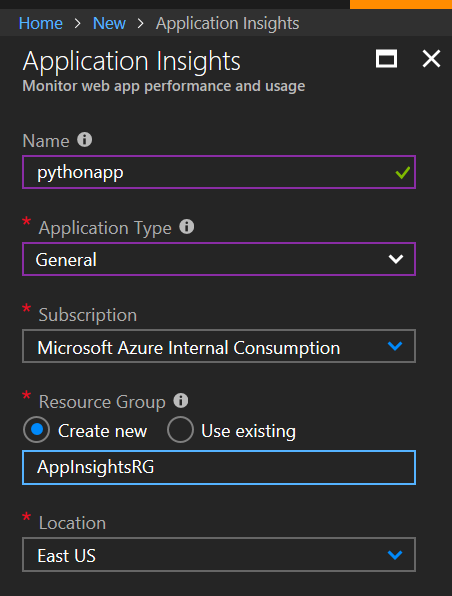
- Enter the app insights details as shown below then click create
- Once the resource is created, go to AppInsightsRG and click on pythonapp.
- In Essentials copy the Instrumentation Key and keep it handy. We will need that later when we start instrumenting our code.
Downloading the Sample Application
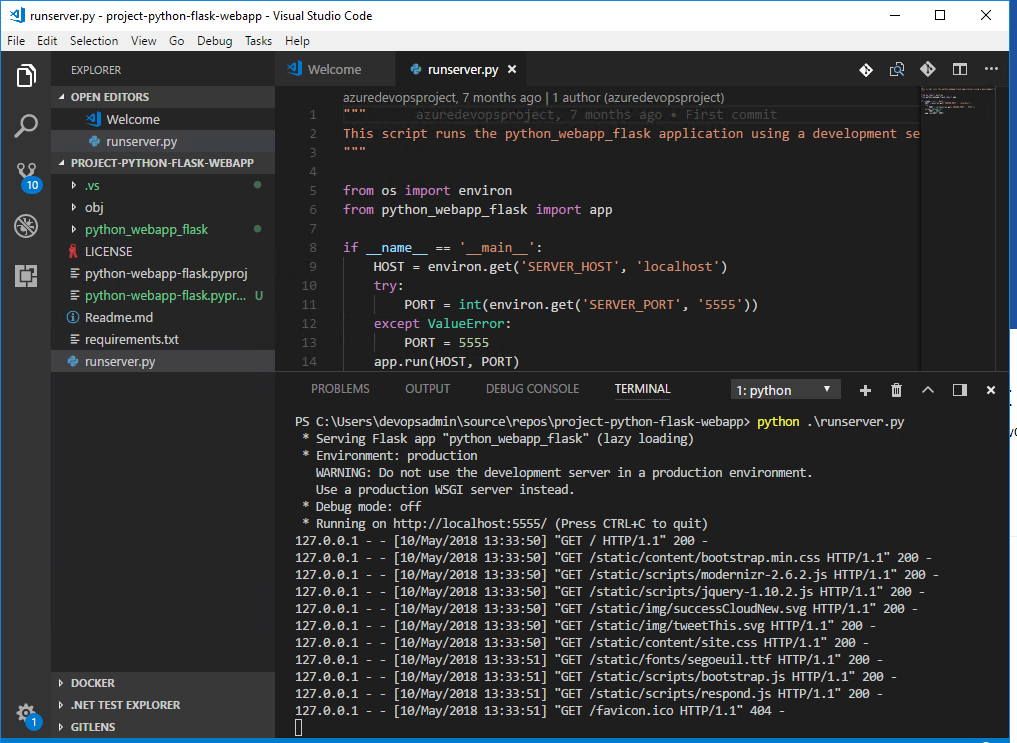
The sample application we will be using for this demo can be cloned from here. Once the code is downloaded from the repository, you can run it by typing:
python .\runserver.py
Instrumenting your Python Application
Install the latest Application Insights Python SDK by running the following command:
pip install applicationinsights
Once the SDK is installed place the snippet below at the bottom of __init__.py file. Make sure you replace '<YOUR INSTRUMENTATION KEY GOES HERE>' with the key you copied in a previous step
 from applicationinsights.flask.ext import AppInsights
app.config['APPINSIGHTS_INSTRUMENTATIONKEY'] = '<YOUR INSTRUMENTATION KEY GOES HERE>'
# log requests, traces and exceptions to the Application Insights service
appinsights = AppInsights(app)
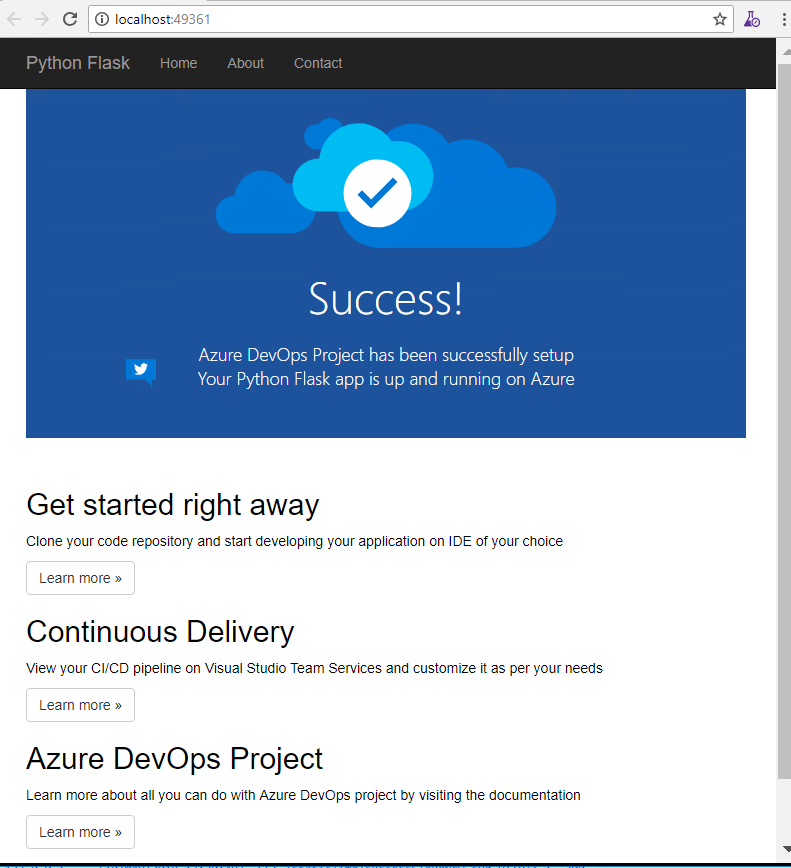
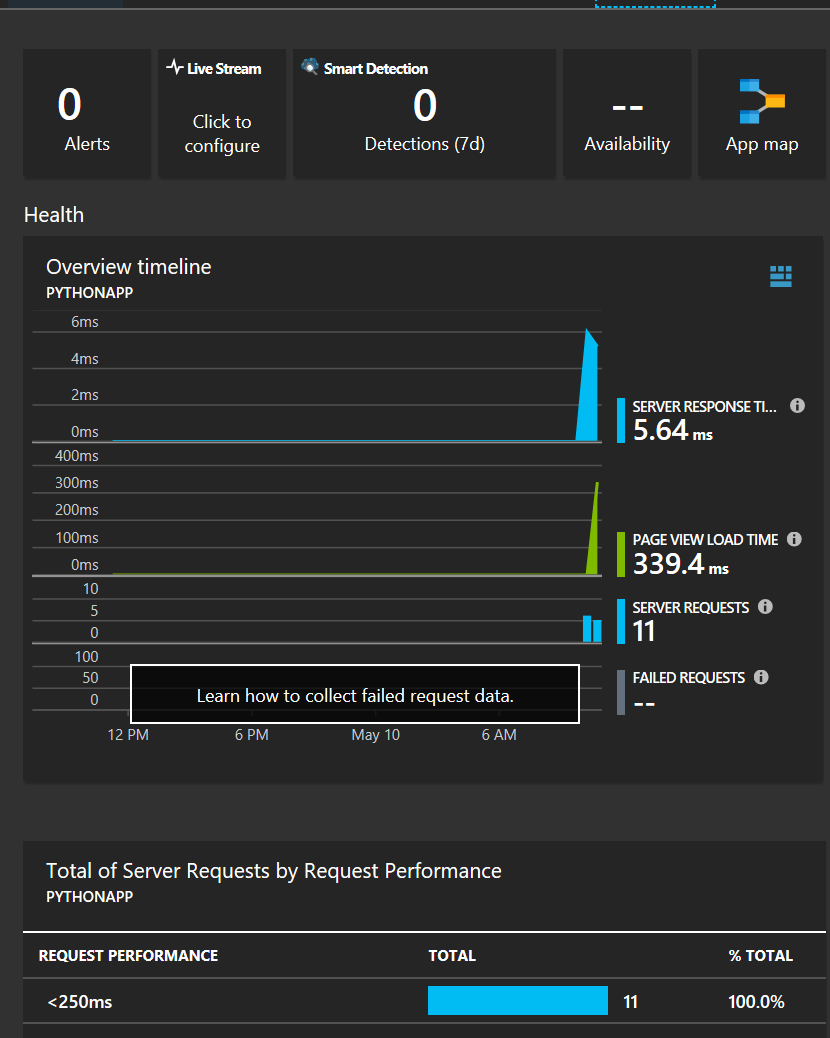
Restart the application, launch a web browser and go to the site and click on the various links on the page. Wait a few minutes, and go to the Application Insights instance, refresh and you should see HEALTH metrics updated:
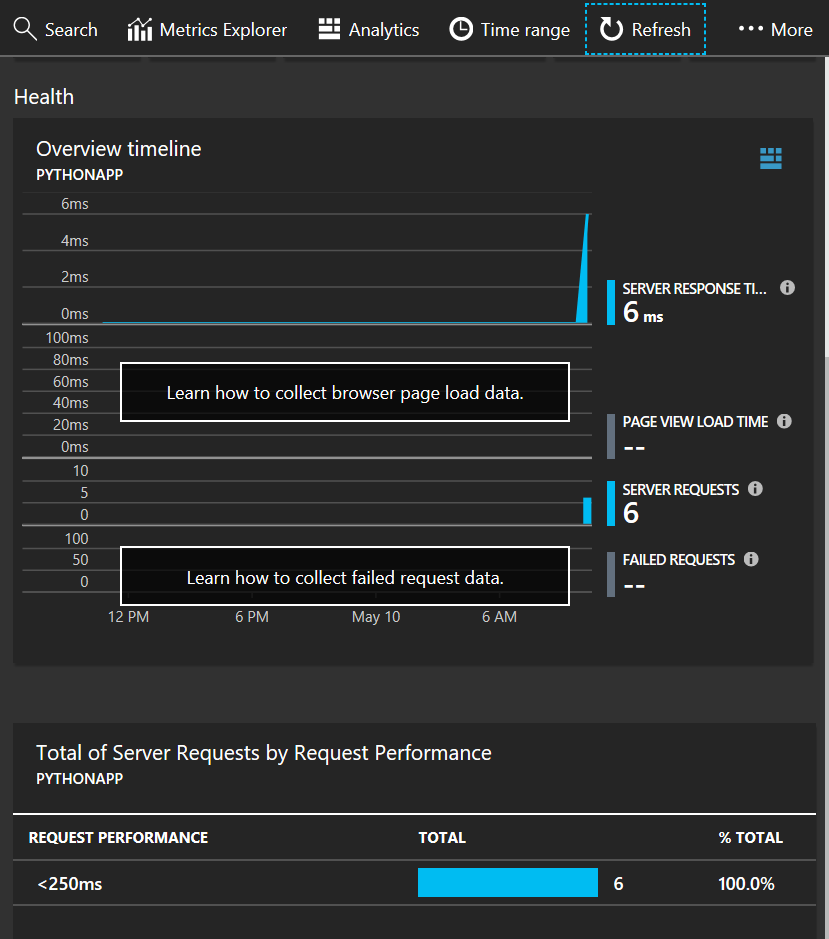
At this point, we are able to send telemetry from the server. However, notice that PAGE VIEW LOAD TIME metric is not updated. The reason for that is we are only sending information from the server side. To get a more complete picture we need to also get the client side to send telemetry to our Application Insights instance. For that, we will need to inject code in the client side of our web application.
Under templates folder, open layout.html. in the <head> section of your html template, copy the following JavaScript snippet. Again, make sure you replace '<YOUR INSTRUMENTATION KEY GOES HERE>' with the key you copied in a previous step
 <script type="text/javascript">
var appInsights=window.appInsights||function(config){
function s(config){t[config]=function(){var i=arguments;t.queue.push(function(){t[config].apply(t,i)})}}var t={config:config},r=document,f=window,e="script",o=r.createElement(e),i,u;for(o.src=config.url||"//az416426.vo.msecnd.net/scripts/a/ai.0.js",r.getElementsByTagName(e)[0].parentNode.appendChild(o),t.cookie=r.cookie,t.queue=[],i=["Event","Exception","Metric","PageView","Trace"];i.length;)s("track"+i.pop());return config.disableExceptionTracking||(i="onerror",s("_"+i),u=f[i],f[i]=function(config,r,f,e,o){var s=u&&u(config,r,f,e,o);return s!==!0&&t["_"+i](config,r,f,e,o),s}),t}({
instrumentationKey: "<YOUR INSTRUMENTATION KEY GOES HERE>"
});
window.appInsights=appInsights;
appInsights.trackPageView();
</script>
Once the client side code is injected, save the file and go to your browser, refresh the page and perform a few clicks. Wait for a few minutes and go to your Application Insights instance, refresh, and you should see the PAGE VIEW LOAD TIME metric updated.
Sending Custom Events
To send custom events from your application, place this snippet at the bottom of views.py file
 @app.route('/track_custom_event')
def track_custom_event():
    from applicationinsights import TelemetryClient
    tc = TelemetryClient(app.config['APPINSIGHTS_INSTRUMENTATIONKEY'])
    tc.track_event('ShoppingCartCheckout')
    tc.flush()
    return render_template('index.html')
Also create a control in your main page that would trigger the custom event. Open index.html under template folder and look for <div class="row"> tag. Replace the content of that section with the following:
<div class="row">
<div class="col-md-4">
<h2>Send Custom Event</h2>
<p>Press button to send custom event called <b>ShoppingCartCheckout</b></p>
<p><a class="btn btn-default" href="{{ url_for('track_custom_event') }}">Custom Event »</a></p>
</div>
</div>
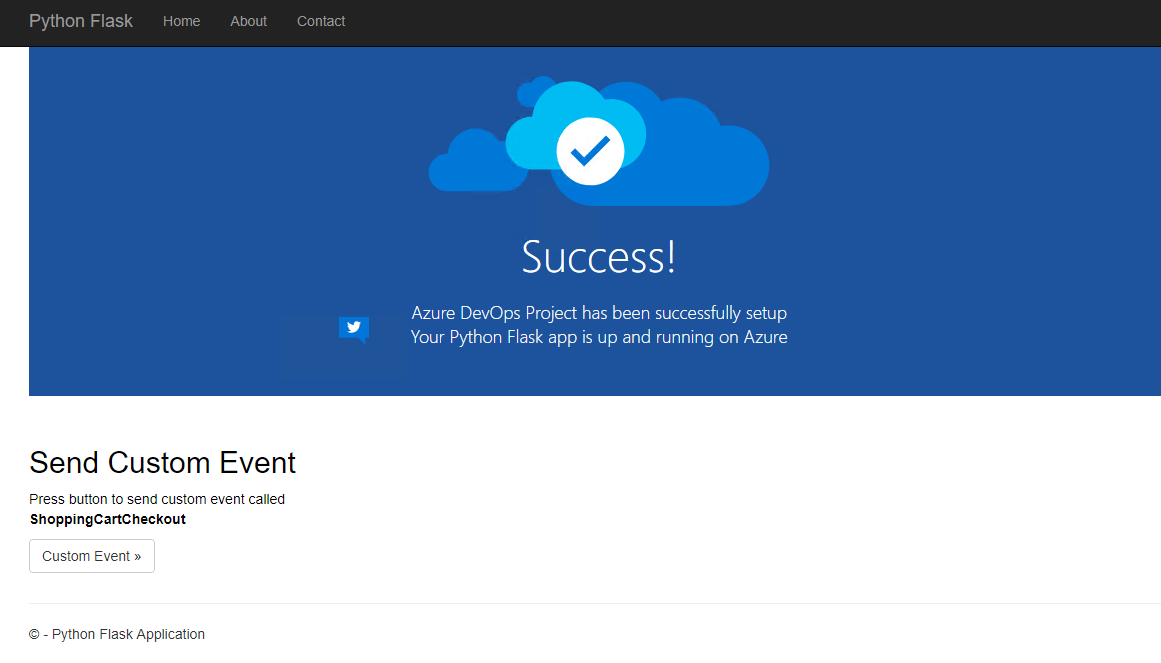
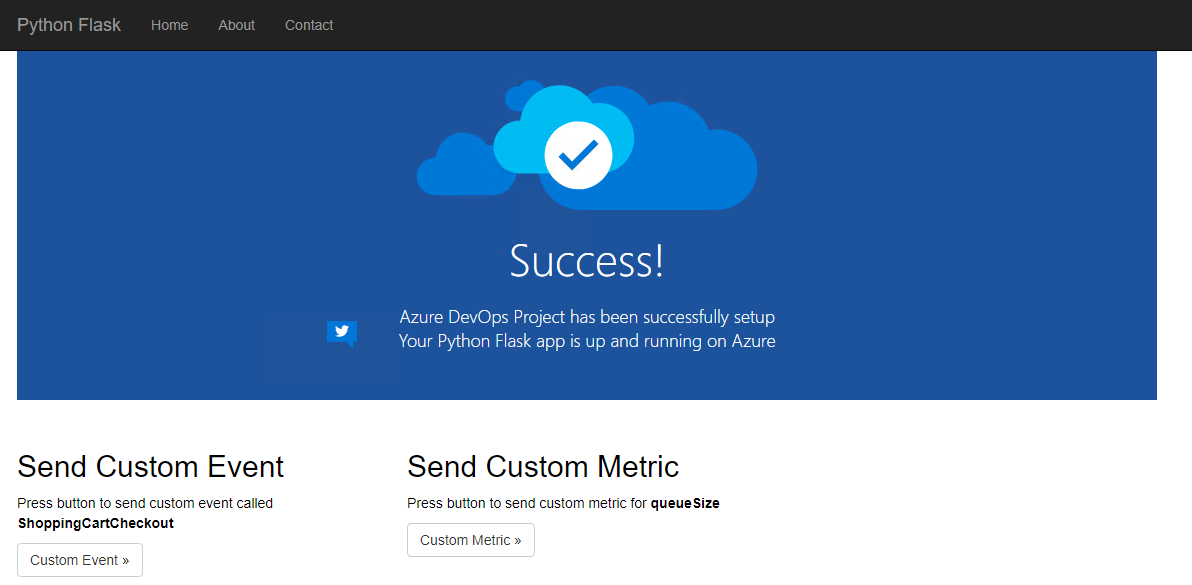
Save the file and rerun the application. Your page should now look like this
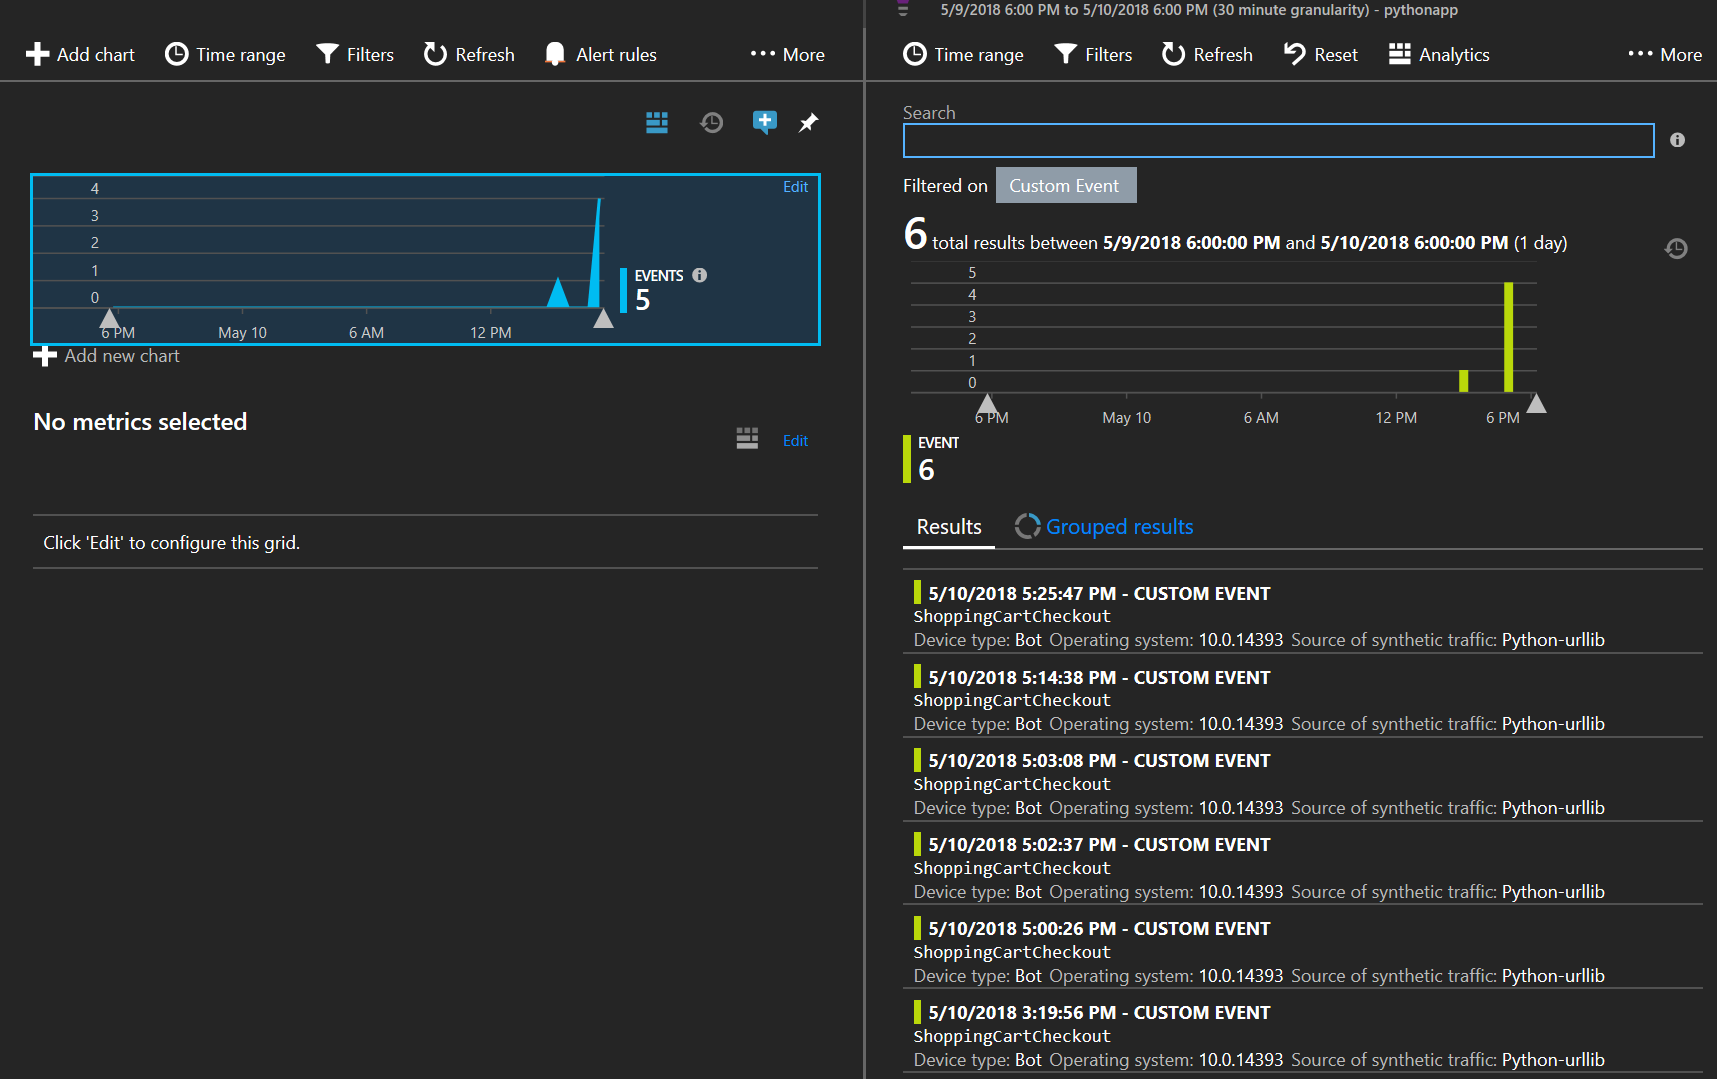
Click on the Custom Event button a few times then go to your Application Insights instance. Under Metrics Explorer, click on Add new chart and on the Chart details make the selection as shown below:
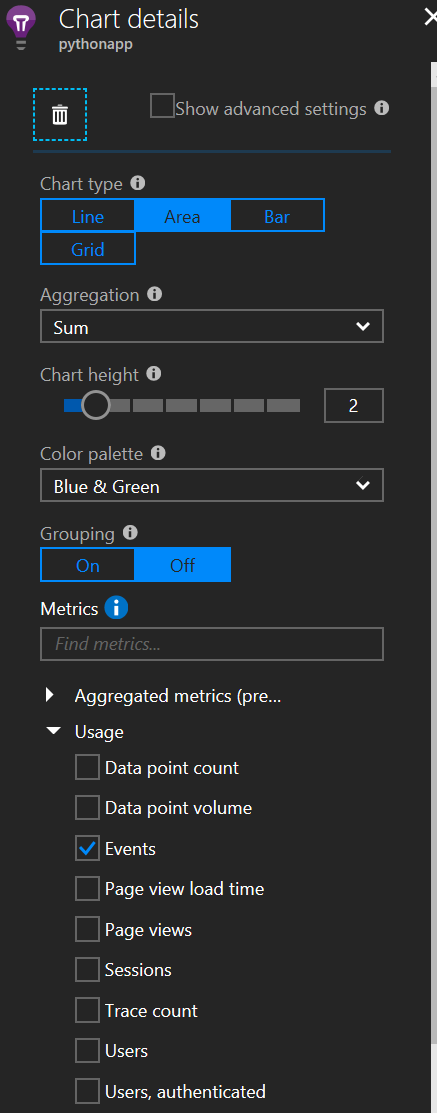
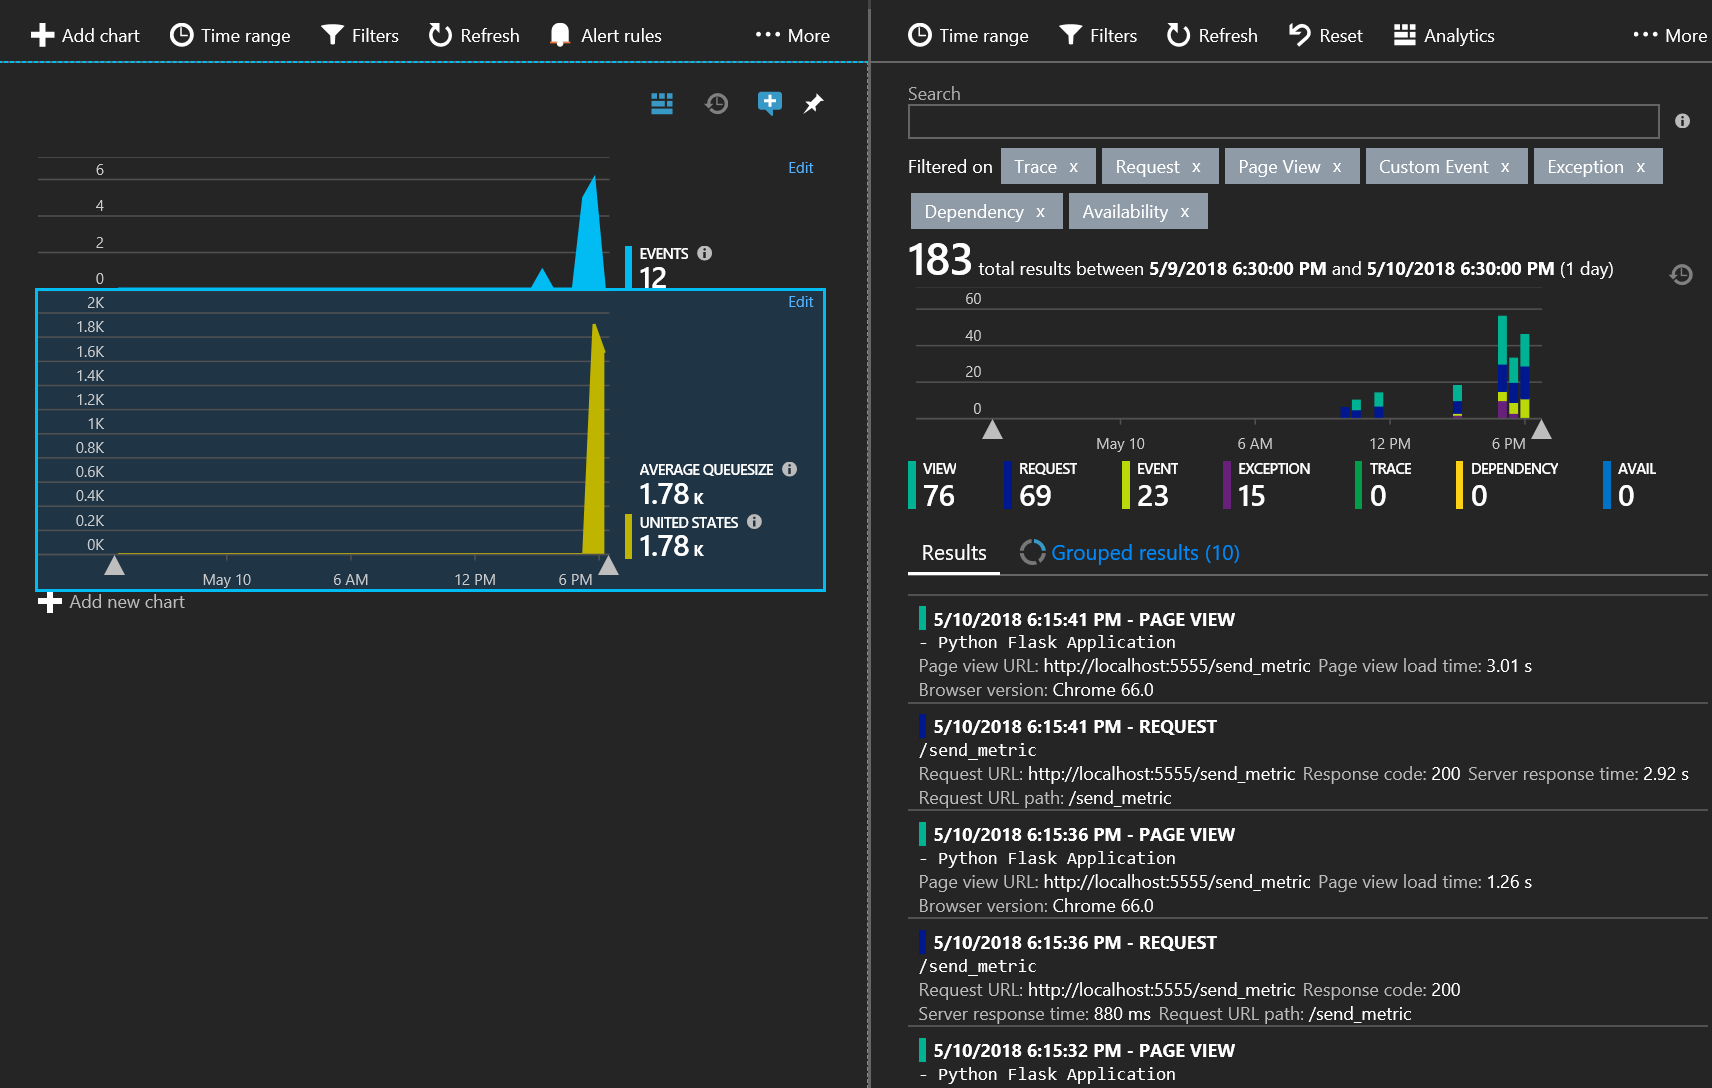
The chart on the left side should show the data related to the custom event sent from your application
Sending Custom Metrics
To send custom metrics from your application, add this snippet of code to your views.py
 @app.route('/send_metric')
def send_metric():
    from applicationinsights import TelemetryClient
    tc = TelemetryClient(app.config['APPINSIGHTS_INSTRUMENTATIONKEY'])
    import random
    tc.track_metric('queueSize',  random.randint(0,5000))
    tc.flush()
    return render_template('index.html')
Add this code to your html template as described in a previous section
<div class="col-md-4">
<h2>Send Custom Metric</h2>
<p>Press button to send custom metric for <b>queueSize</b></p>
<p><a class="btn btn-default" href="{{ url_for('send_metric') }}">Custom Metric »</a></p>
</div>
Reload your application and now it should look like this
Click on the Custom Metric button a few times then go to your Application Insights instance. Under Metrics Explorer, click on Add new chart and on the right make the selection as shown below:
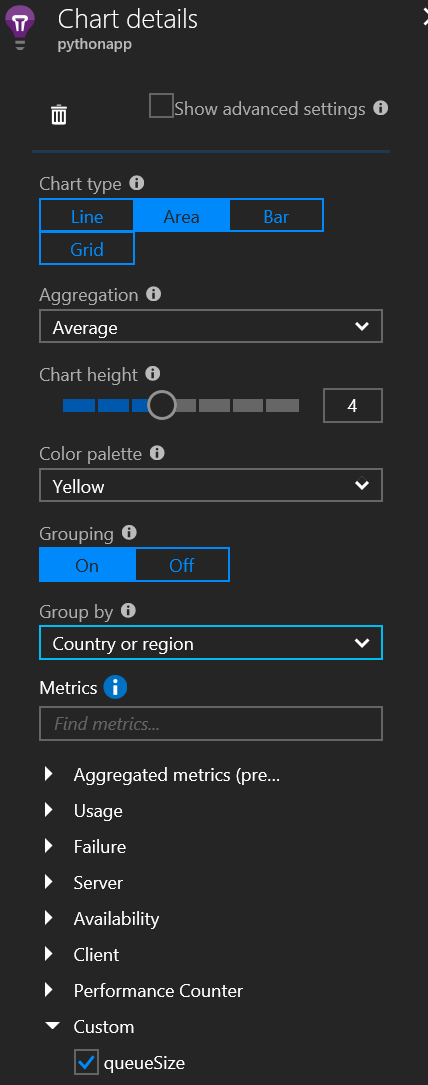
The chart on the left should show the data related to the custom metric sent from your application
Reporting Handled Exceptions
To show an example of handled exceptions sent to Application Insights, let’s create a route that raises random exceptions. Also we will inject the code that will report those exceptions to Application Insights. Add the snippet below to your views.py file:
 @app.route('/handledException')
def handledException():
    import sys
    import string
    import random
    from applicationinsights import TelemetryClient
    tc = TelemetryClient(app.config['APPINSIGHTS_INSTRUMENTATIONKEY'])
    try:
        randomstring = ''.join([random.choice(string.ascii_letters) for n in xrange(8)])
        raise Exception("Exception {0}".format(randomstring))
    except:
       tc.track_exception()

    try:
       randomstring = ''.join([random.choice(string.ascii_letters) for n in xrange(8)])
       raise Exception("Exception {0}".format(randomstring))
   except:
       tc.track_exception(*sys.exc_info(), properties={ 'foo': 'bar' }, measurements={ 'x': 42 })
       tc.flush()

   return render_template('index.html')
Add this code to your html template as described in a previous section
<div class="col-md-4">
<h2>Trigger handled Exception</h2>
<p>Press button to trigger a random handled exception</p>
<p><a class="btn btn-default" href="{{ url_for('handledException') }}">Handled Exception »</a></p>
</div>
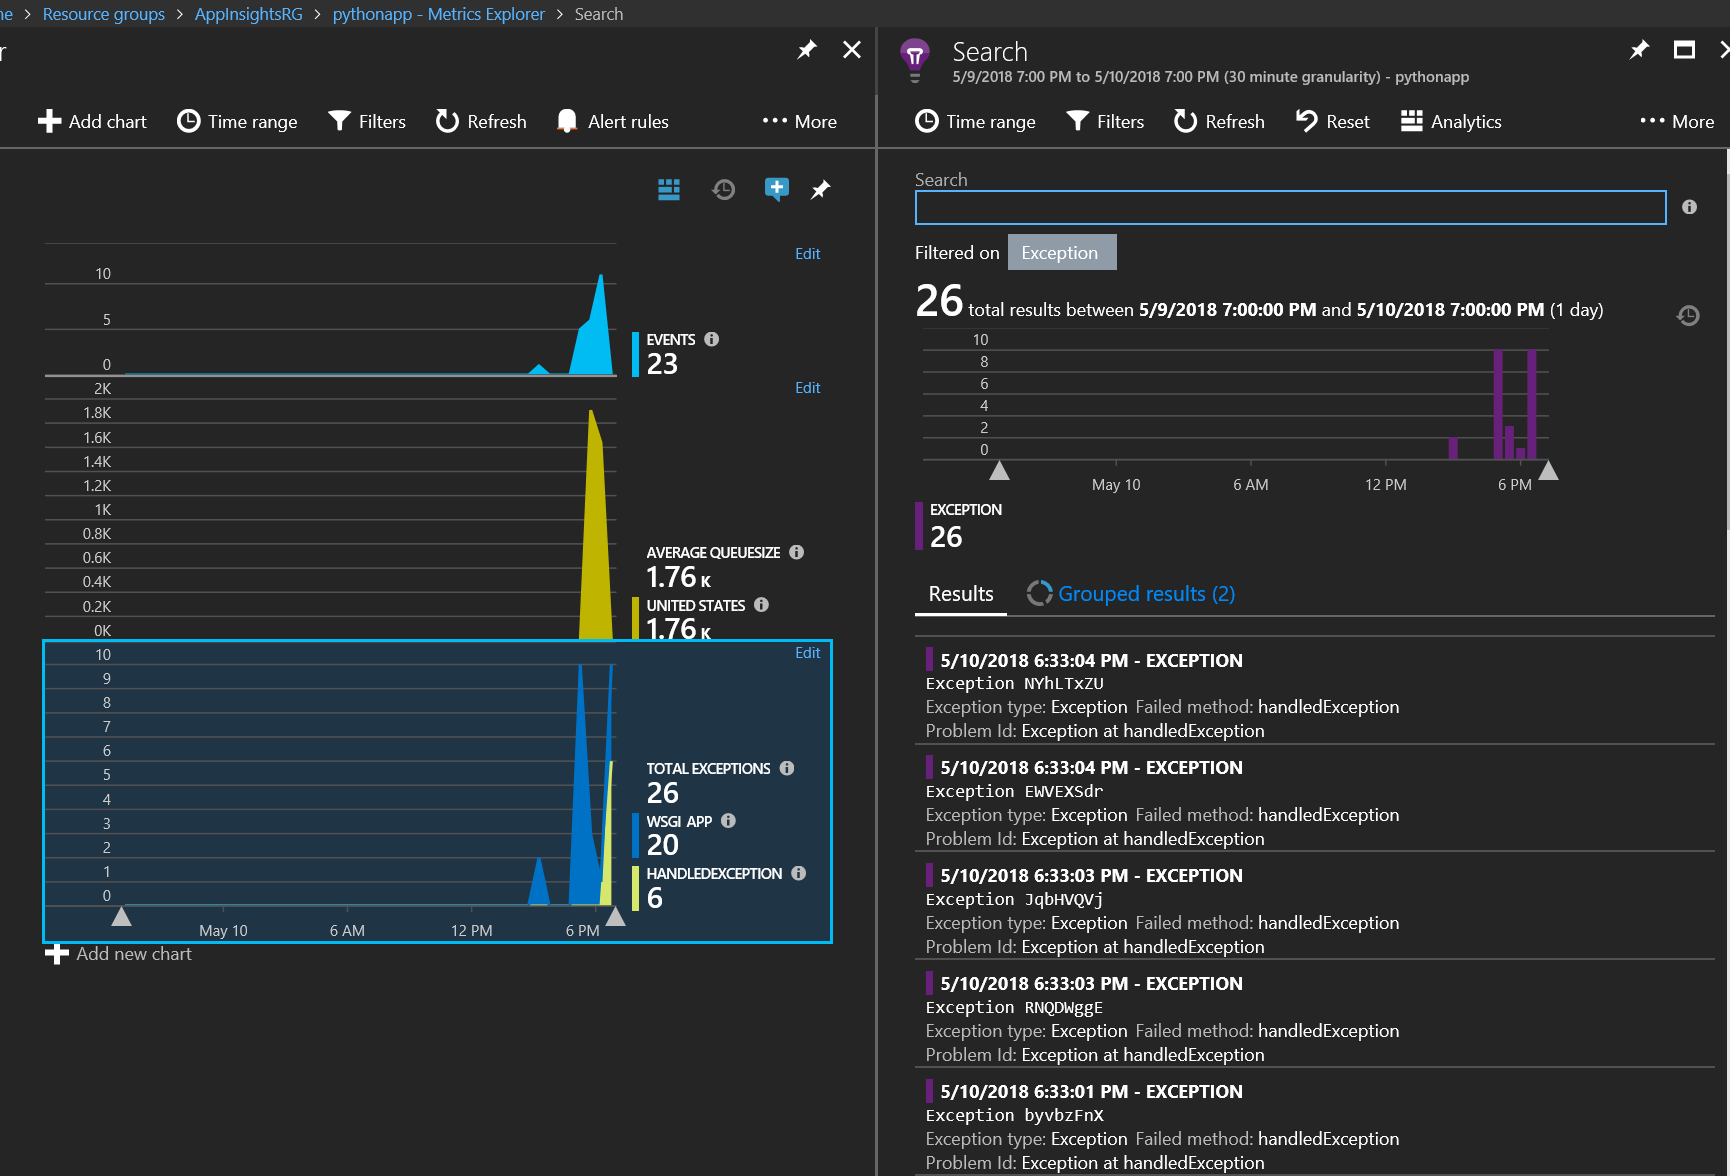
Click on the Handled Exception button a few times then go to your Application Insights instance. Under Metrics Explorer, click on Add new chart and on the right make the selection as shown below:
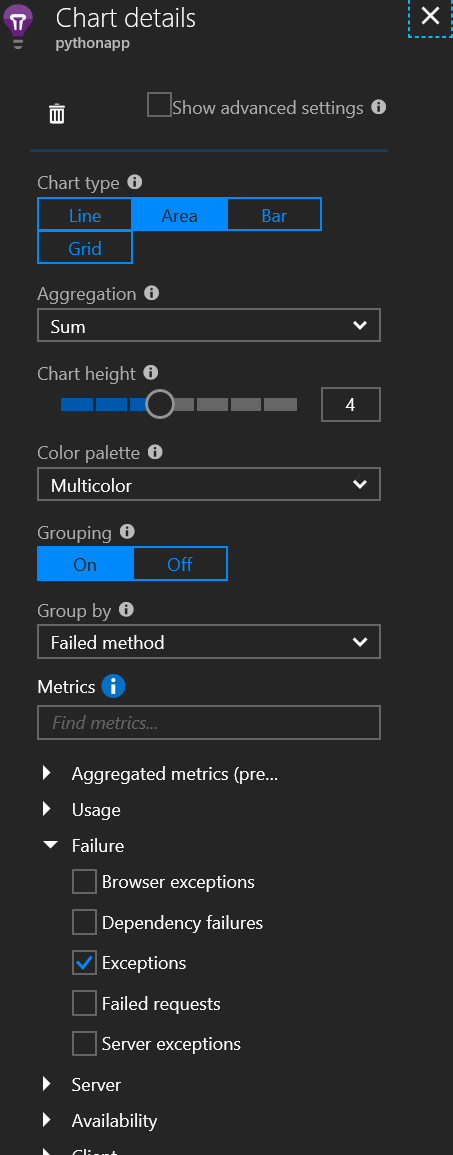
The chart on the left should show the exceptions sent from your application
Wrap-up
We have just shown how you can send telemetry data from a Python application that uses Flask framework. You can get the complete code from a branch called instrumented here. Note that the complete code is refactored so it might not look exactly the same as the steps described above.
I hope this blog was useful. Please leave your feedback on how future blogs can be improved.