Demystifying decision forests
By Michele Usuelli, Lead Data Scientist
This article doesn't require a data science background, but just some basic understanding of predictive analytics. Besides that, all the concepts are explained from scratch, including a popular algorithm called the "decision forest". Throughout the article you won't see any fancy or advanced machine learning algorithm, but by the end you will have more clarity about how decision forests work.
Dealing with predictive analytics, decision forests are popular techniques as they usually produce satisfying results requiring a little data preparation. Decision forests, like other machine learning models, are often perceived as obscure in the way they operate. This leads to the misconception that artificial intelligence consists in building a machine doing some magic on the data.
The scope of this article is to demystify this and to prove that decision forests operate in a simple transparent way. Also, their way of operating is somehow similar to the human approach to decision-making.
To demonstrate this, we use as an example a mock use-case based on simulated data. Even if the solution makes sense from a logical standpoint, its assumptions are not necessarily related to reality. A customer of a bank requests a mortgage and the bank must decide whether to give them a loan or not. How does the decision-making process work?
The bank can use some information related to the customer such as their credit score, age, income, excluding everything that could lead to discrimination or legal issues. Starting from historical data about other customers, the bank knows who couldn't pay off the mortgage. If it's possible to map out the profile of insolvent customers, the bank can come up with a way of identifying them.
The bank has already put together some information about their previous customers into a nice structured table. Also, to make everything easier, around half of the customers failed. Assuming that we are in the utopian scenario of having the data nice and clean, this is the table.
## creditScore houseAge yearsEmploy ccDebt year default id
## 1 708 21 5 4190 2002 0 26472
## 2 649 20 3 2151 2003 0 37088
## 3 725 23 3 3603 2005 0 57076
## 4 785 24 4 5534 2009 0 90648
## 5 649 14 6 5243 2002 0 20110
## 6 734 21 0 3441 2008 0 89639
The columns are
- Credit score: score measuring the "reliability" of the customer, assessed by a third party
- House age: age of the house they're purchasing
- Years of employment
- Debt on the credit card
- Year in which they purchased the house
- Failure: 1 if the customer didn't pay off the loan, 0 otherwise
Out of the five personal details, that we can call "features", which is the most relevant? After having identified it, we can divide the customers into two groups based on the most relevant feature. Then, for each of the two groups, we repeat the process of finding the most relevant feature and we split the customers into two sub-groups. A popular algorithm, called decision tree, works exactly in this way. In the end, the tree divides the customers into eights groups and we know the percentage of customers experiencing a default per group. We can visualise it through the following chart.
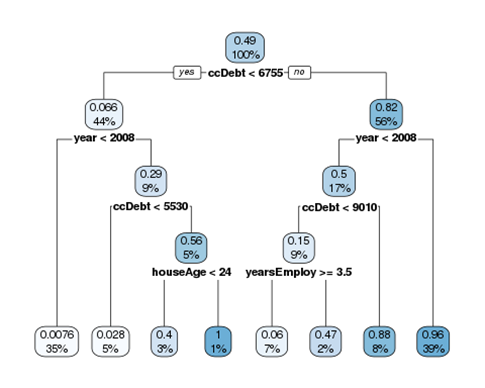
At each split of the tree, the first number is a score representing the portion of customer failing. Since 49% of the customer had a default, the initial score is 0.49. Also, the colour of the boxes gets darker as the score gets higher. The second number represents the percentage of customers belonging to the group. At the beginning, it's 100%. Then, at each level, it shows the proportion of customers into each split.
Not surprisingly, the most relevant indicator is the debt on the credit card. 6.6% of the customers having a debt below 6755 experienced a failure, opposed to 82% of the customers having a debt equal to or above 6755.
The tree visualization shows in a simple way how the model works. Having a new customer, the bank can estimate its propensity of not paying off the debt. How does it work? Not having any information about a customer, its probability of failing is the percentage of failures in the past. In this case, it's 49%. Then, knowing the credit card debt, we go down to the second level of the tree and the score can either increase or decrease, depending on the impact of credit card debt. The impact of knowing the credit card debt is:
- if below ccDebt < 6755, the score becomes 6.6%, so it gets decreased by 42.4%
- if above ccDebt <= 6755, the score becomes 82%, so it gets increased by 33%
Summarising, this is the impact:
- ccDebt < threshold: -0.424
- ccDebt <= threshold: +0.33
In the same way, we can measure the impact of being above or below the threshold of other features. If the same feature is being used more than once, we can simply sum up the effects. Depending on the customer, the path on the tree is different, so the features being used and their impact changes. To keep track of that, we can sum up the effects separately for each customer and visualise them through a decision-making heatmap. Each row corresponds to a customer and each column correspond to being above or below a threshold for a given features (e.g., ccDebt < any threshold at some point in the tree). The colour is blue if the score decreases and red if it increases, and the less transparent it is, the higher the impact.
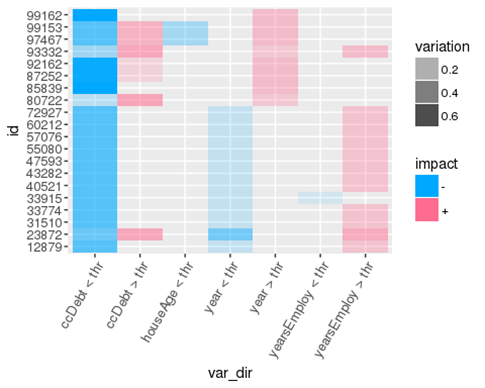
Measuring the impact of each feature, the bank can explain the decision-making process to assign each score, given more transparency and clarity to its customers.
As shown above, a decision tree operates in a way that is like the human problem solving. Coming back to the original topic, we want to demystify decision forests. As the name suggests, a decision forest is a combination of decision trees.
A hundred people can access some information of the bank, but each person is aware of a part of the customers and of a part of their features. If we ask each of them to build a decision tree, we'll have 100 different trees. Applying the trees on a new customer, each of them will assign a different score. To come up with a unique answer, we can compute the average score. That's exactly how a decision forest works: we build decision trees on a random subset of the information, then we combine them. This methodology, called "ensembling", usually improves the performance of the solution.
Since there might be several trees in the forest, it'll be time-consuming to have a look at each tree separately. However, it's still possible to measure the impact of each feature across all the trees. Combining them, we can build a decision-making heatmap taking account of everything. Therefore, the bank can explain the decision-making process of the entire forest.
The methodology shows by the article gives transparency and clarity about the way random forests operate. A similar approach is applicable in other contexts and it allows to give more clarity about how machine learning operates.